biochrom Ultrospec 3300 pro User manual

Declaration of Conformity
This is to certify that the Ultrospec 3300 pro UV/Visible Spectrophotometer
Part number 80-2112-33 / 34 / 35 / 36
Serial number 81000 onwards
manufactured by Biochrom Ltd. conforms to the requirements of the following
Directives-: 73/23/EEC & 89/336/EEC
Standards to which conformity is declared
EN 61 010-1: 1993 Safety requirements for electrical equipment for
measurement, control and laboratory use.
EN 61326-2.3: 1998 Electromagnetic compatibility - Generic emission standard
part 1. Electrical equipment for measurement, control and laboratory use.
EN 61000-4-6: 1992 Electromagnetic compatibility - Generic immunity standard
part 1. Residential, commercial and light industry.
Signed: Dated: 2nd July 2001
David Parr
Managing Director
Biochrom Ltd
Postal address Telephone Telefax
Biochrom Ltd +44 1223 423723 +44 1223 420164
22 Cambridge Science Park
Cambridge CB4 0FJ
England
Registered in England No: 974213
Registered Office: 22 Cambridge Science Park, Milton Road, Cambridge CB4 4FJ, England.
Biochrom Ltd
Certificate No. 890333

________________________________________________________________
___
Issue 02 - 07/2001 English 1
CONTENTS
UNPACKING, POSITIONING AND INSTALLATION 2
Essential Safety Notes 3
OPERATION 4
Introduction 4
Keypad and display 5
Basic Modes 7
Methods 9
Nucleic 10
Protein 16
Wavescan 22
Multiwave 24
Kinetics 27
Standard Curve 29
Substrate 31
Instrument Utilities 33
Output to Printer 35
Download to Spreadsheet 36
Messages 36
ACCESSORIES 38
Multiple Cell Holder Accessories 38
Single Cell Holder Accessories 39
Other Accessories, consumables etc 40
SWIFT II Applications Software 41
MAINTENANCE 42
After Sales Support 42
Lamp Replacement 43
Deuterium Lamp Warranty 45
Fuse Replacement 45
Cleaning and General Care 46
APPENDIX 47
Pharmacopoeia 47
Good Laboratory Practice 48
Equation Entry using MultiWave 51
Kinetics 54
Least squares regression analysis and linearity 58
SPECIFICATION AND WARRANTY 59

________________________________________________________________
___
2English Issue 02 - 07/2001
Unpacking, Positioning and Installation
•Inspect the instrument for any signs of damage caused in transit. If any damage
is discovered, inform your supplier immediately.
•Ensure your proposed installation site conforms to the environmental conditions
for safe operation:
Indoor use only
Temperature 10°C to 40°C
Maximum relative humidity of 80 % up to 31°C decreasing linearly to 50 % at
40°C
•The instrument must be placed on a hard flat surface, for example a laboratory
bench or table, which can take its weight (13 kg) such that air is allowed to
circulate freely around the instrument.
•Ensure that the cooling fan inlets and outlets are not obstructed; position at
least 2 inches from the wall.
•This equipment must be connected to the power supply with the power cord
supplied and must be earthed (grounded). It can be used on 90 - 240V supplies.
•Switch on the instrument and check that the display works (see Operation). It
can be configured to have the display and print outs in English (0), German (1),
French (2), Spanish (3), Italian (4) or Russian (5) by pressing the number in
brackets as the instrument powers up (default is English).
•The instrument is delivered with a stored baseline. This is required to correct for
the wavelength/energy profile of the light sources. A new baseline should be
stored when a lamp is changed or if the instrument is not used for a long time
(several weeks); refer to Maintenance for details.
•To enter laboratory name, operator name, instrument asset number, current
date/time and to configure for a particular type of printer, refer to Instrument
Utilities.
This is a “press to read” instrument, whereas other deuterium / tungsten lamp
instruments measure continuously. The lamps will switch off from stand by
mode automatically if the instrument is not used for 15 minutes; the message
“Turning lamp on…” will appear for a few seconds when the instrument is re-
used.
If this equipment is used in a manner not specified or in environmental conditions not
appropriate for safe operation, the protection provided by the equipment may be
impaired and instrument warranty withdrawn.

________________________________________________________________
___
Issue 02 - 07/2001 English 3
Essential Safety Notes
There are a number of warning labels and symbols on your instrument. These are
there to inform you where potential danger exists or particular caution is required.
Before commencing installation, please take time to familiarise yourself with these
symbols and their meaning.
Caution (refer to accompanying documents).
Background colour is yellow, symbol and outline are black.
UV RADIATION UV RADIATION IS HARMFUL TO YOUR EYES
HOT If power is restored with this cover removed,
eye protection must be worn
Accessories
•Care should be taken when handling all heated accessories.
•Ensure that the cell compartment lid is closed when operating cell changers and
the sipper.
•It is essential that the baseplate plug supplied with single cell accessoriesis
fitted to optimise air flow and to prevent light ingress.
WARNING WARNING

________________________________________________________________
___
4English Issue 02 - 07/2001
OPERATION
Introduction
Your UV/Visible spectrophotometer is a stand alone, simple-to-use instrument with a
high-resolution liquid crystal display (LCD), and a comprehensive range of
spectrophotometry measurements can be undertaken. It fulfils the requirements of
the Pharmacopoeia (Appendix).
It works on the basis of light from the deuterium and tungsten lamps being directed
by a fixed mirror through the monochromator inlet slit. This passes through one of
several (dependent on wavelength selected) filters mounted on a filter quadrant; the
filtered light is then directed onto the holographic grating that produces light of the
selected wavelength. The light then leaves the monochromator via the exit slit, and
mirrors focus and direct the light into the sample compartment. This passes through
your cell, containing the sample of interest, and then a defocusing lens to a solid
state detector unit. The resulting signal is then filtered and displayed.
Your spectrophotometer:
•Measures standard absorbance, concentration and % transmission.
•Has stored parameters for DNA, RNA and oligonucleotide quantification and
purity checking, cDNA fluorophore label check, nucleic acid wavelength scan
and a calculation facility for Tm; there is also useful information concerning
nucleic acids in general.
•Has stored parameters for Bradford, Lowry, Biuret, BCA and UV methods for
protein determination; there is also useful information concerning proteins and
amino acids in general.
•Has Application Modes for
-Wavescan (Wavelength Scanning )
-Enzyme Kinetics
-Multiple Wavelength (Equation Entry)
-Standard Curve
-Substrate Concentration
•Can store up to 50 user-defined methods
•Can download results directly via the serial interface for manipulation in Excel
and for data storage and archiving
•Has GLP self diagnostics
A range of accessories further enhances the capability of the instrument.

________________________________________________________________
___
Issue 02 - 07/2001 English 5
Keypad and display
Navigation around the displays, presented in an index card format, and the options
therein is by using the 3456 keys; pressenter or 6to select an option.
Number, letter and base entry will become active when appropriate.
•press mode to select measurement mode or to recall set-up pages, enabling
selection of post run routines, after obtaining results
•press function to access instrument utilities
•press set refto set reference at all wavelengths in the mode selected; this is
subtracted from all subsequent samples in the experiment
•press print to output graphics and results to a parallel printer or PC; this is
automatic if Auto-print is selected (see Instrument Utilities)
•press enter to select an option on the display
•press Cto clear a numeric entry. If in Nucleic Acid or Multi-Wavelength modes,
Cenables set reference in order to restart another experiment
•press run to start measurements when operating from within the measurement
modes; this may set reference automatically in “non-Basic” modes . Sample
number (and cell position) is automatically incremented.
•press stopto end current activity; use as an “escape mechanism” to stop making
measurements or to return to main menu

________________________________________________________________
___
6English Issue 02 - 07/2001
There are two standard formats of display, depending on the measurement mode:
a) Basic (Absorbance, %Transmission, Concentration), Nucleic (DNA, RNA, Oligo)
and Protein (UV methods) have a simple layout, with information presented in a
box on the LCD.
b) Other measurement modes have a graphical layout with information about the
instrument also being provided along a status bar which shows messages,
whether a printer is connected or not, time, accessory fitted (cell number for
multi-cell holder) and wavelength. There are also messages that tell the user
what needs to be done to perform a routine, and the status of the instrument
during this routine; for example set-ref, setting-ref, load sample, running sample.

________________________________________________________________
___
Issue 02 - 07/2001 English 7
Basic Modes
In the basic modes it is possible to change cell position by pressing the required
number on the keypad.
Absorbance
Absorbance mode measures the amount of light that has passed through a sample
relative to a blank (this can be air). The procedure is as follows:
•Enter appropriate wavelength and pressenter
•Enter appropriate sample number and pressenter
•Insert reference and pressset ref. The cell changer, if fitted, automatically
moves to position 2 and displays the result for the reference measurement (0.000)
•This is a “press to read” instrument, whereas other deuterium / tungsten
lamp instruments measure continuously. Thus to monitor sample
stabilisation, the simple kinetics mode must be used
•This reference value is used for subsequent samples until changed
•Insert samples as required and pressrun (repeat as necessary)
•To go back and change the wavelength pressmode
% Transmission
Transmission mode measures the amount of light that has passed through a sample
relative to a blank (this can be air), but displays the result as a percentage. The
relationship between the concentration of the sample and its transmittance at any
given wavelength is not linear, and hence transmission mode is rarely used
experimentally except for samples having very high absorbances (low
transmittances). The procedure is as follows:
•Enter appropriate wavelength and pressenter
•Enter appropriate sample number and pressenter
•Insert reference and pressset ref. The cell changer, if fitted, automatically
moves to position 2 and displays the result for the reference measurement
(100%)
•This reference value is used for subsequent samples until changed
•Insert samples as required and pressrun (repeat as necessary)
•To go back and change the wavelength pressmode

________________________________________________________________
___
8English Issue 02 - 07/2001
Concentration
There are two concentration modes, Factor and Standard.
Factor Concentration mode is used when a conversion factor is known; this is
required to convert the absorbance measurement for a sample at a specific
wavelength to a concentration, by a simple multiplication of absorbance * factor.
Standard Concentration mode is used when a sample of known concentration is
available; by measuring the absorbance of this at a specific wavelength, the
conversion factor is calculated (see above), and this can be applied to other samples
of unknown concentration, This is equivalent to a one point calibration, and
assumes that sample of zero concentration has zero absorbance.
The procedure is as follows:
•Enter appropriate wavelength and pressenter
•Enter appropriate sample number and pressenter
•Select mode, Factor or Standard using4
•If Factor
•Concentration of unknown = Absorbance * factor
•Enter factor, range 0.01 – 99999
•Select units using4
•Insert reference and pressset ref.
•Insert samples as required and pressrun (repeat as necessary)
•If Standard
•Concentration of unknown = Absorbance of unknown * Concentration of standard
Absorbance of standard
•Enter concentration of standard
•Select units using4
•Insert reference and pressset ref.
•Insert standard and pressrun (calculates factor)
•Insert samples as required and pressrun (repeat as necessary)
•Concentration of sample relative to standard is displayed

________________________________________________________________
___
Issue 02 - 07/2001 English 9
Methods
Recall
To recall a stored method from memory
1. Select whether it is between 1-10, 11-20, etc by using4
2. Select the method number
The appropriate mode is obtained; load reference and samples, and pressrun
Clear
To clear a stored method from memory
1. Press C
2. Select whether it is between 1-10, 11-20, etc by using4
3. Select the method number
4. Confirm yes (enter) or no (4enter 4)
Save
Stored methods, up to a maximum of 50, are saved directly from within an application
by selecting the save option. To save a method in memory
1. Select whether is to be between 1-10, 11-20, etc
2. Enter the method number
3. Enter the title (refer to Instrument Utilities); press4to get the an alphanumeric
keypad or enter directly from the keypad
Print
Press print to obtain a list of all method names and numbers.

________________________________________________________________
___
10 English Issue 02 - 07/2001
Nucleic
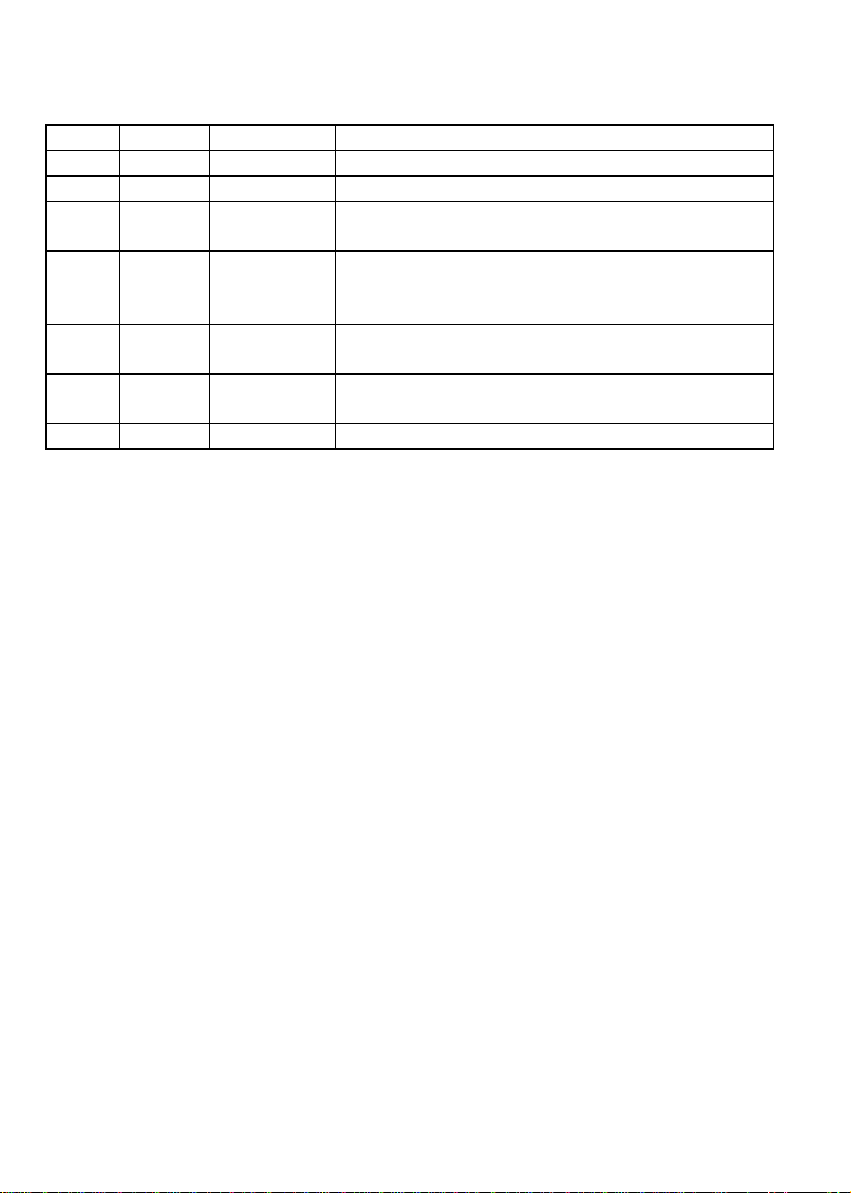
Mode Factor A260/A280 Use
DNA 50 ng/µl 1.8 DNA quantification and purity checking
RNA 40 ng/µl 2.0 RNA quantification and purity checking
Oligo 33 ng/µl Sequence
dependent Oligonucleotide quantification and purity checking
cDNA
label 50 ng/µl Fluorescent cDNA and PCR probe quantification
for micro-arrays andin-situ hybridisation studies,
respectively
Scan - - Spectrum of samples, as well as quantification and
purity check of selected wavelengths
Tm - - Calculate theoretical Tm for a nucleotide base
sequence
Info - - Information relating to nucleic acids
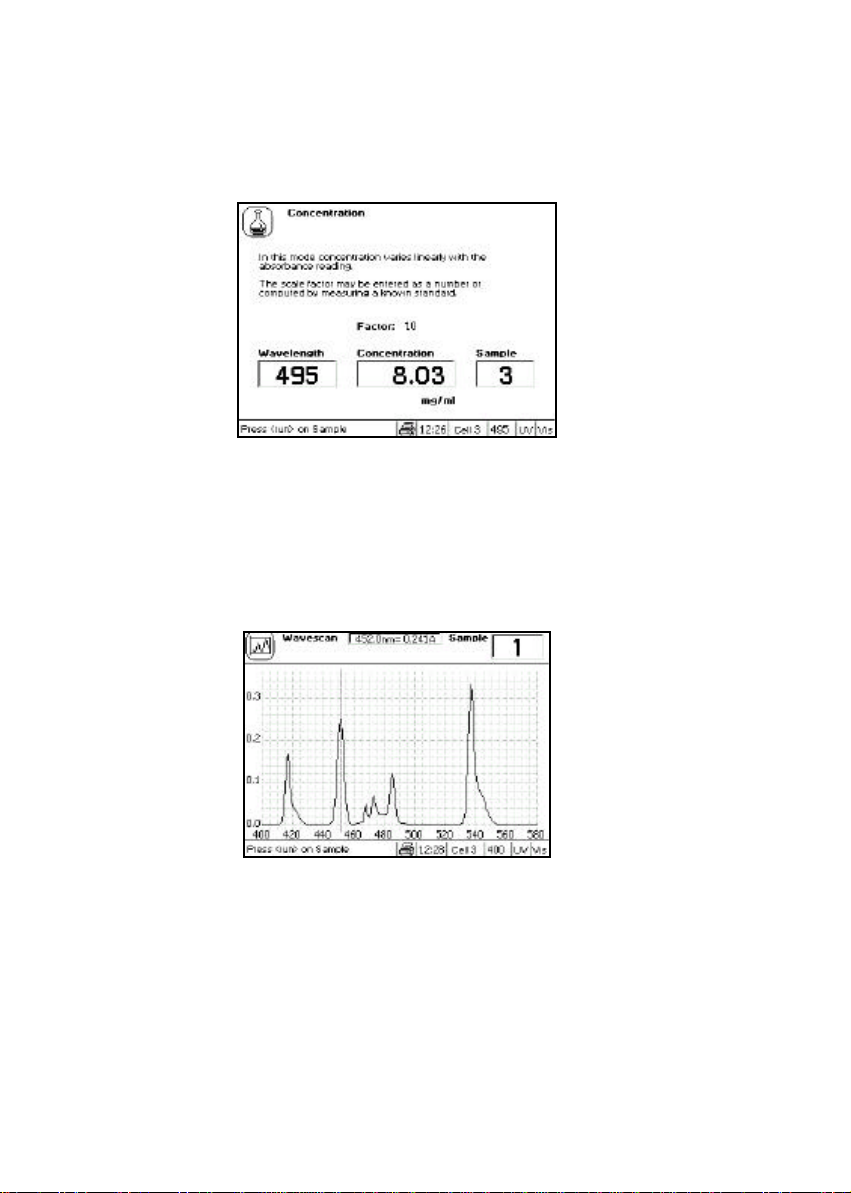
Nucleic acids can be quantified at 260 nm because it is well established that a
solution of DNA or RNA with an optical density of 1.0 has a concentration of 50 or
40 µg/ml, respectively, in a 10mm pathlength cell. Oligonucleotides, as a rule of
thumb, have a corresponding factor of 33 µg/ml, although this does vary with base
composition.
Concentration = Abs260 * Factor
Extracting nucleic acids from cells is accompanied by protein, and extensive
purification is required to separate the protein impurity. The 260/280 ratio gives an
indication of purity; it is only this, however, and not a definitive assessment. Pure
DNA and RNA preparations have expected ratios of ≥1.8 and≥2.0, respectively;
deviations from this indicate the presence of protein impurity in the sample, but care
must be taken in interpretation of results. An elevated absorbance at 230 nm can
indicate the presence of impurities as well; 230 nm is near the absorbance maximum of
peptide bonds and also indicates buffer contamination since Tris, EDTA and other
buffer salts absorb at this wavelength. When measuring RNA samples, the 260/230
ratio should be > 2.0; a ratio lower than this is generally indicative of contamination
with guanidinium thiocyanate, a reagent commonly used in RNA purification and
which absorbs over the 230 – 260 nm range. A wavelength scan of a sample can also
be obtained for visual inspection of integrity over the range 200 – 350 nm.
Absorbance ratio = Abs260 / Abs280
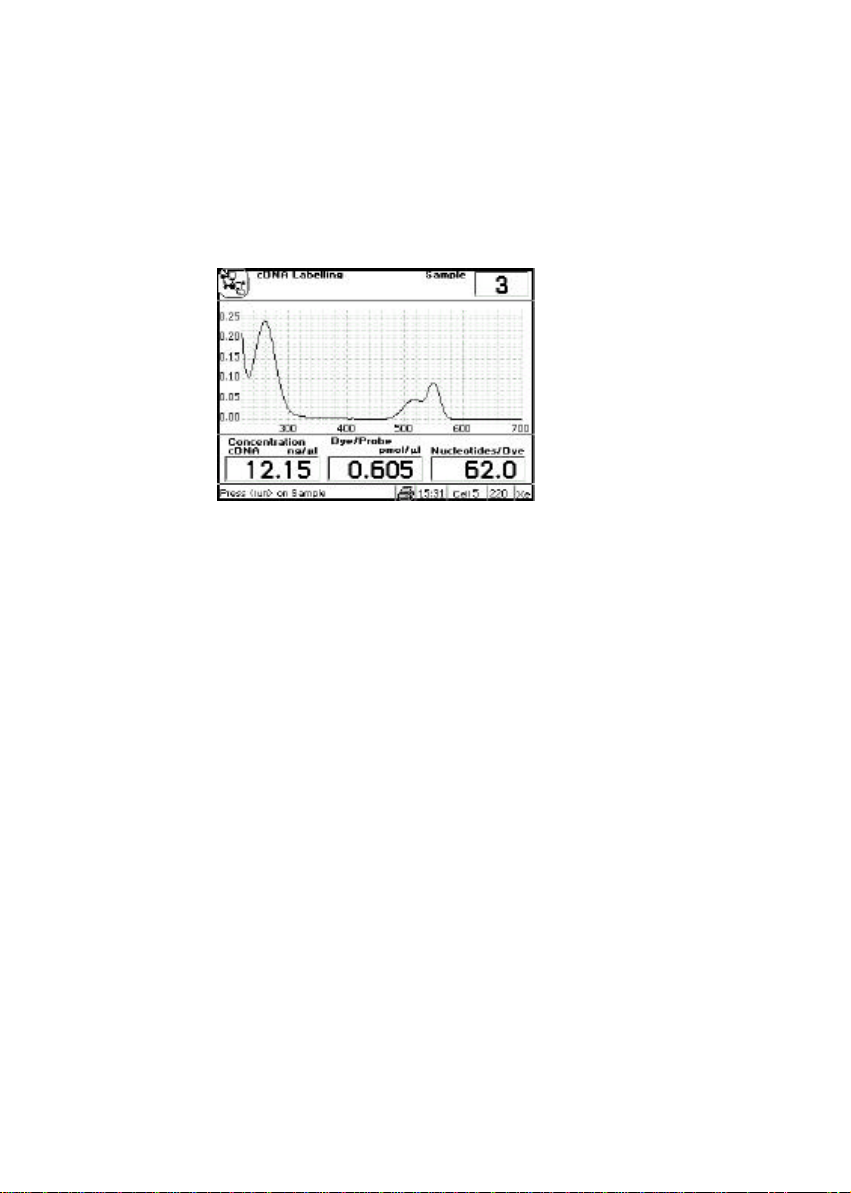
cDNA and PCR tagged with fluorescent probes can be scanned up to 850 nm so that
both peaks can be used to monitor labelling efficiency.

________________________________________________________________
___
Issue 02 - 07/2001 English 11
Background correction at a wavelength totally separate from the nucleic acid and
protein peaks at 260 and 280 nm, respectively, is sometimes used to compensate for
the effects of background absorbance. The wavelength used is 320 nm and it can
allow for the effects of turbidity, high absorbance buffer solution and the use of
reduced aperture cells. If your laboratory has not used background correction
before, set this option to no. It should be used with UViMicro disposable cells.
Concentration = (Abs260 – Abs320) * Factor
Absorbance ratio = (Abs260 –Abs 320) / (Abs280 –Abs 320)
The spectrophotometer calculates concentration, displays 260/280 ratio and
compensates for sample dilution. If you wish to use other wavelengths, for example
if the peak maximum is at 257 nm or a background correction of 350 nm, use nucleic
scan or absorbance ratio modes.
Use of 7 µl volume ultramicrovolume cell
•If using this cell, please note that it has a 5 mm pathlength, and that these modes
assume a 10 mm pathlength cell is used.
•Ensure the cell is filled correctly by holding up to the light using the viewer
supplied with the cell; this is to avoid the possibility of the liquid meniscus
being in the light beam and causing non-reproducible results.
•Background compensation at 320 nm is useful when using restricted aperture
cells such as this
DNA, RNA, Oligo
•Select if background correction at 320 nm is required using4
•Enter the sample dilution factor
•If oligo
•Enter the conversion factor if known, default is 33 µg/ml. The factor can be
calculated from a known base sequence if the concentration is known (see
Tm Calculation).
•Enter the integration time using4
•Default is 1 second, other options are 2, 5 and 0.1 seconds. Use long
integration times for very low and very high absorbance readings.
•Save method if required using4
•Insert reference and samples, and pressrun
•If using a single cell holder
•Insert reference and pressset ref.
•Insert sample and pressrun (repeat as required)

________________________________________________________________
___
12 English Issue 02 - 07/2001
cDNA
Measurement of the labelling efficiency of fluorescently labelled cDNA probes
before 2-colour microarray hybridisation ensures that there is sufficient amount of
each probe to give satisfactory hybridisation signals. This data also provides an
opportunity to balance the relative intensities of each fluorescent dye by adjusting
the concentration of each probe before hybridisation. The cDNA yield is measured
at 260 nm while the incorporation of fluorescein, Cy3 and Cy5 are measured at their
absorption peaks. This method may also be useful for measuring the yields and
brightness of fluorescently labelled in-situ hybridisation probes.
The procedure is as follows:
Set up
•Select the fluorophore label from Cy3, Cy5, Fluorescein using4
•Select if background correctionnm is required using 4
•Required if using UViMicro disposable cells to account for potential
differences between cells. UViMicro cells are ideal for this application, since
the minimum volume that can be used is 20µl.
•If selected, enter wavelength required
•Default values are 430nm for Cy3/Cy5 and 400nm for Fluorescein
•It is important that there is no absorbance due tocarried over buffer or
other components from the purification step at the selected wavelength.
•Enter the amount of starting RNA inng
•RNA can be quantified using the RNA or Scan modes
•Enter the sample dilution factor
•Enter the cDNA conversion factor to be applied to Abs260
•Enter the probe volume in µl
Scan
•Select if scanning is to be enabled; we recommend that scan is always on.
•If yes
•Enter the start wavelength and pressenter
•Only go below 220nm if using quartz cells
•Enter the end wavelength and pressenter
•Select scan speed as appropriate; slow , medium or fast, using4
•We recommend medium; note that the graph for low and medium scans
is smoothed.
•Save method if required using4
•Insert reference and samples, and pressrun
•If using a single cell holder
•Insert reference and pressset ref
•Insert sample and pressrun (repeat as required)

________________________________________________________________
___
14 English Issue 02 - 07/2001
After measurement, the scan will autoscale. Typically, the scan will show 2 peaks, at
260nm for cDNA and around that of the fluorophore selected (488, 550 and 650 nm for
fluorescein, Cy3 and Cy5, respectively). Buffer carry over may obscure the peak at
260 nm, and Abs260/Abs230 ratio will be affected. If this is the case, then it is not
possible to determine the amount of nucleic acid reliably with this method. However,
the determination of fluorophore concentration is still possible (see Results, below).
The results for cDNA concentration (ng/µl), dye/probe concentration (pmo/µl) and
nucleotides/dye are presented.
Results
Use this facility to view the underlying absorbance data that give these results,
together with absorbance ratios and the yield of cDNA (% andng).
If the Abs260/Abs230 ratio < 1.5, the peak at 260nm is poorly defined, and results
which use Abs260 in the calculations will not be meaningful (cDNA concentration,
nucleotides / dye, cDNA yield % and Total cDNA). A low Abs260/Abs230 ratio may
be due to:
•buffer carry over, or
•impurities raising the Abs230 value and affecting the Abs260 value also, or
•the solution may be too dilute.
Note that the dye/ probe (pmol/µl) result is not affected by a poor Abs260/Abs230
ratio.

________________________________________________________________
___
Issue 02 - 07/2001 English 15
Scan
The integrity of a nucleic acid sample can be established by inspection of its
spectrum over the range 200 – 350 nm. This mode is particularly useful for RNA and
oligonucleotide samples. The procedure is as follows:
•Start wavelength is fixed at 200nm. If usinga UV transmitting disposable plastic
cell such as UViMicro, strange optical effects between 200 and 220 nm may be
observed. These can be ignored.
•Enter end wavelength and pressenter (range is 350 – 600 nm)
•Enter λ1; this is used for quantification and absorbance ratio calculations
•Enter λ2; this is used for absorbance ratio calculations
•Select if background correction is required using4
•If yes, enter λB
•Enter the sample dilution factor
•Enter the factor to be applied toλ1
•Save method if required using4
•Insert reference and samples, and pressrun
λ1can be changed post run using4. This is very useful for optimisation; note that
concentration and ratio results are updated automatically.
Tm Calculation
Tm, the theoretical annealing temperature, can be calculated for a primer or
oligonucleotide if the base sequence and its concentration in solution are known;
this is useful for PCR and sequencing studies. The parameter is calculated on the
basis of thermodynamic calculations for each base in the nucleotide chain in relation
to its neighbours (Breslauer et al, Proc. Natl. Acad. Sci. USA, 83, 3746). The
procedure is as follows:
•Select mode, DNA or RNA, using4(T is replaced by U in RNA)
•Enter the molar concentration of buffer / salts
•Enter the concentration of primer /oligo in µg/ml (or ng/µl)
•Enter the base sequence using the keypad (keys 1, 4, 7, .for C, G, T/U, A,
respectively)
•Note that the length (inmer) and the molecular weight of the oligo are
shown as the sequence is entered; once 10 mer is reached the concentration
in pmol/µl, conversion factor (µg/ml) and theoretical Tm (°C) are displayed
Info
General information relating to cell selection, formulae for mass to moles conversion
and the codon dictionary is available.

________________________________________________________________
___
16 English Issue 02 - 07/2001
Protein
Determination of the amount of protein in solution can be conveniently determined
using colorimetric methods in conjunction with a UV/Visible spectrophotometer. A
number of methods are available, four of which are included as built in options on the
instrument; note that the wavelengths used can vary with manufacturers’ kits.
Generic UV methods and information relating to proteins and amino acids are also
included.
Bradford
This method depends on quantitating the binding of a dye, Coomassie Brilliant Blue,
to an unknown protein and comparing this binding to that of different amounts of a
standard protein, usually bovine serum albumin (BSA). It is designed to quantify 1
to 10 µg of protein. Protein determinations in the range 10 – 100 µg may be carried
out by increasing the volume of the dye solution 5-fold, and using larger tubes.
Lowry
The Lowry method depends on quantifying the colour obtained from the reaction of
Folin-Ciocalteu phenol reagent with the tyrosyl residues of an unknown protein and
comparing this colour value to those derived from a standard curve of a standard
protein, usually BSA at 750nm. This assay is designed to quantify 1 to 20 µg of
protein. Protein determinations in the range 5 – 100 µg may be carried out by
increasing all volumes 5-fold, and using larger tubes.
Biuret
This method depends on the reaction between cupric ions and peptide bonds in an
alkali solution, resulting in the formation of a complex absorbing at 546nm. The
quantification is linear up to 130mg/ml when absorbance is measured after a
standardised reaction time, and the method can be applied to routine analyses of
serum and urine.
BCA
This method also depends on the reaction between Cupric ions and peptide bonds,
but in addition combines this reaction with the detection of Cuprous ions using
bicinchonic acid (BCA), giving an absorbance maximum at 562nm. The analysis has a
working range of 1-2000 µg/ml.
UV methods
This includes estimation of protein concentrations in nucleic acid solutions, and
empirical methods for protein determination at 205, 280 and 215, 225 nm.

________________________________________________________________
___
Issue 02 - 07/2001 English 17
Information
Information relating to proteins and amino acids.

________________________________________________________________
___
18 English Issue 02 - 07/2001
Bradford, Lowry, Biuret, BCA
These all follow the same format; wavelengths, numbers of standards and other
parameters can be edited, including concentrations, which can vary from one
manufacturer’s kit to another. The protocols can therefore be modified to suit your
needs; for example, position 1 can be a reference blank (assumed to be 0.000
absorbance, 0.000 concentration), position 2 the background set to 0.000
concentration units, with subsequent standards as appropriate (the method can then
be saved). The procedure is as follows:
A choice of 3 curve fit methods is provided for the standards:
•Linear regression – the best straight line through the data points, calculated
using a least squares fit (requires a minimum of 3 data points), and the linearity
(quality of line fit) are calculated (see Appendix)
•Linear interpolation – joins up consecutive data points by a series of straight
lines
•Spline – calculates and fits the best curved line through the data points using a
natural cubic spline fitting method (requires a minimum of 4 data points)
Set up
•Enter the wavelength
•Select the curve type from linear regression, linear interpolation, spline using 4
•Enter the number of standards, maximum is 9
•Enter the number of replicates for each standard, maximum is 3
•Enter the number of replicates for the samples, maximum is 3
•Select units using4
Concs
•Enter the concentrations of the standards in increasing order
•Select the integration time using4
•Default is 0.1 second, other options are 1, 2, and 5 seconds. Use long
integration times for very low and very high absorbance readings.
•Save method parameters if required using4
•To save the actual standard curve plot of concentration – absorbance data,
return to this mode by pressingmode after running the set of standards, and
then save the method parameters and data together.

________________________________________________________________
___
Issue 02 - 07/2001 English 19
Running Standards
•Insert reference and standards, and pressrun
•A reference is always required in position 1, and is assumed to be zero
absorbance and zero concentration
•To include a zero concentration standard, include this in the number of
standards to be entered and enter 0.00 for concentration; use another blank
when required to enter standard 1
•Standards should be loaded in order of increasing concentration
•Replicates and means are shown on the display as unfilled and filled
squares, respectively
Running Samples
•When the instrument has standards on the display, it expects samples to be run
•Press run after the standards have been run or a method has been recalled
•If loading new standards, insert reference and standards and select yes
•If loading samples, insert reference and samples and select no
•Samples have to be run separately and individually
•If a sample absorbance is within 10% of the ends of the calibration curve, the
curve will be extrapolated linearly from the end points to accommodate this; if
this is done, it is indicated o the display and on the print out
Graph
This facility enables scaling of the results, and defines how they are to be presented
on the LCD and print out.
•Enter the maximum absorbance to be shown on the display
•Enter the minimum absorbance to be shown on the display
•Select if automatic scaling of the results to fit the display is required post run
Standards
This facility enables the concentrations andabsorbances of the standards to be
viewed, together with mean absorbance with standard error % (SE) if replicated were
used. If linear regression curve fit has been selected, the slope, intercept and
linearity of the regression are shown.

________________________________________________________________
___
20 English Issue 02 - 07/2001
UV methods
Protein Impurity
The presence of nucleic acid in a protein solution can have a significant effect due to
strong nucleotide absorbance at 280 nm. To compensate for this by measuring Abs
260, the equation of Christian andWarburg for the protein crystalline yeastenolase
(Biochemische Zeitung 310, 384 (1941)) can be applied:
Protein (mg/ml) = 1.55 *Abs 280 – 0.76 *Abs 260
This equation can be applied to other proteins if the corresponding factors are
known. To customise the equation for a particular protein, the absorbances at 260
and 280 nm should be determined at known protein concentrations to generate simple
simultaneous equations; solving these provides the two coefficients. In cases where
Factor 2 is found to be negative, it should be set to zero since it means there is no
contribution to the protein concentration due to absorbance at 260 nm. The use of
background correction at 320 nm is optional.
Protein (mg/ml). = (Factor 1 *Abs 280) – (Factor 2 *Abs 260)
Set Factor 2 = 0.00 for directλ280 UV protein measurement; Factor 1 is based on the
extinction coefficient of the protein. If BSA (bovine serum albumin) is an acceptable
standard, setting Factor 1 = 1.115 will give linear results from 0 to 0.8 mg/ml protein.
Protein (mg/ml) = 1.115 *Abs 280
Rapid measurements such as this atAbs 280 are particularly useful after isolation of
proteins and peptides from mixtures using spin andHiTrap columns by centrifuge
and gravity, respectively.
The procedure is as follows:
•Select if background correction at 320 nm is required using4
•Enter Factor 1
•Enter Factor 2
•Save method if required using4
•Insert reference and samples, and pressrun
Table of contents
Other biochrom Measuring Instrument manuals

biochrom
biochrom Libra S50 Instruction Manual

biochrom
biochrom WPA Lightwave 3 User manual

biochrom
biochrom Novaspec III Plus User manual

biochrom
biochrom Libra S4 User manual

biochrom
biochrom Libra S6 User manual

biochrom
biochrom Libra S35 PC User manual

biochrom
biochrom Ultrospec 50 User manual

biochrom
biochrom Libra S21 User manual

biochrom
biochrom HB Ultrospec 7500 User manual

biochrom
biochrom WPA Lightwave S2000 User manual