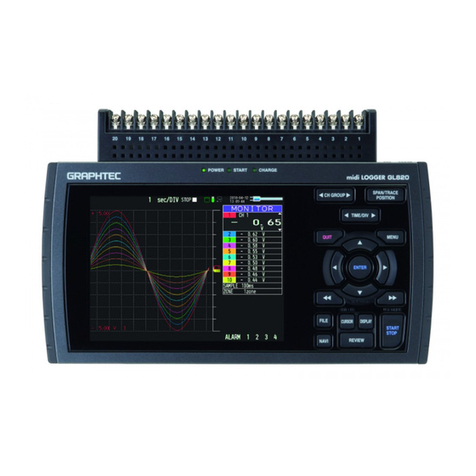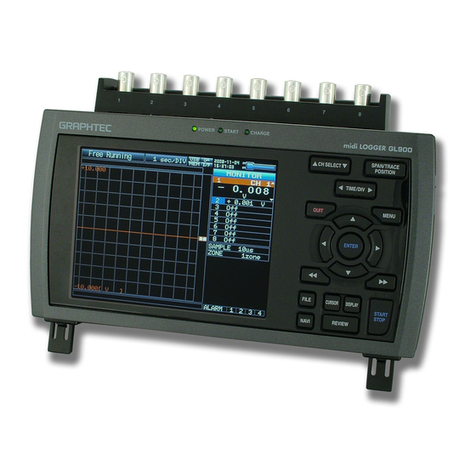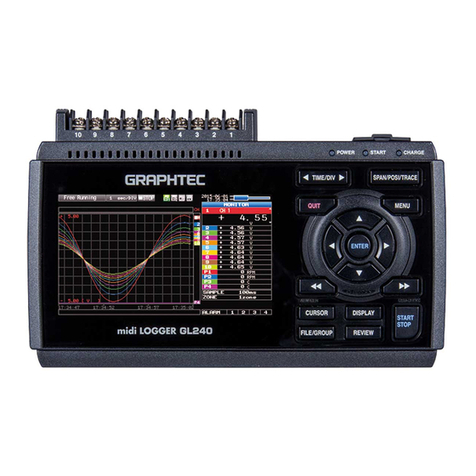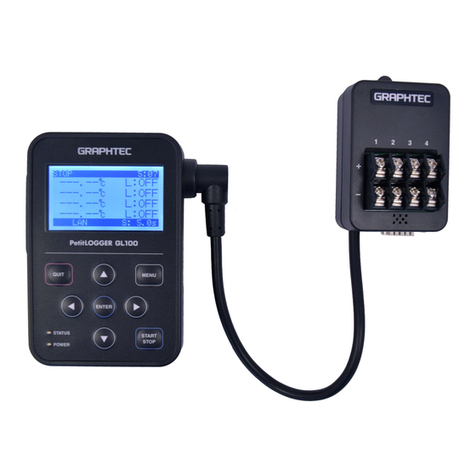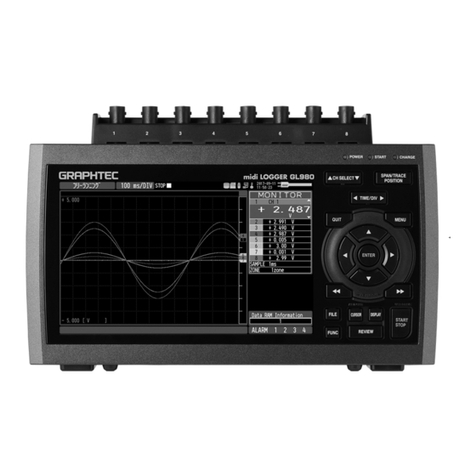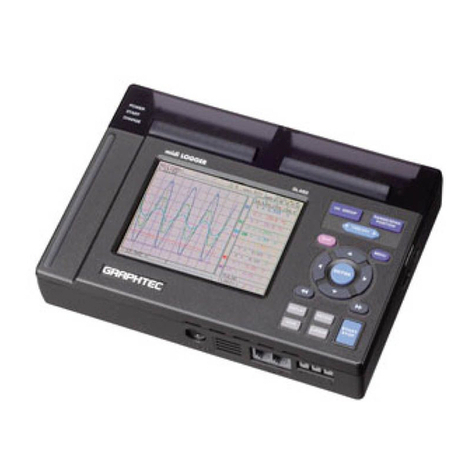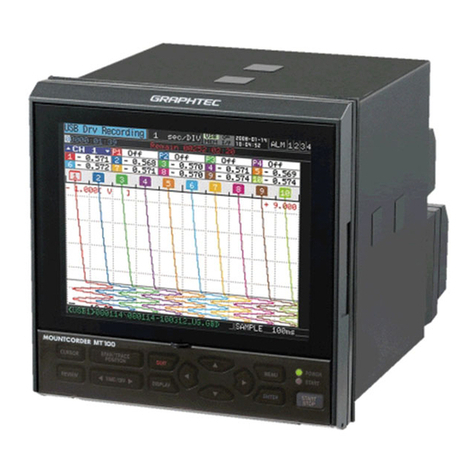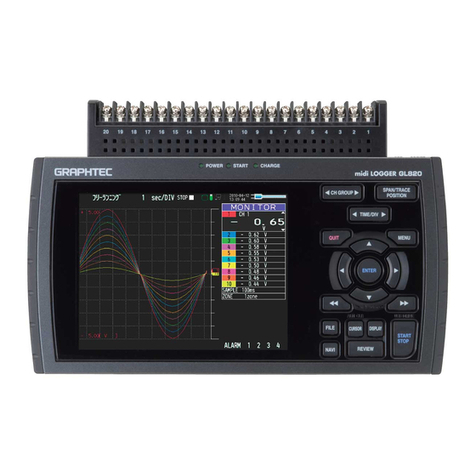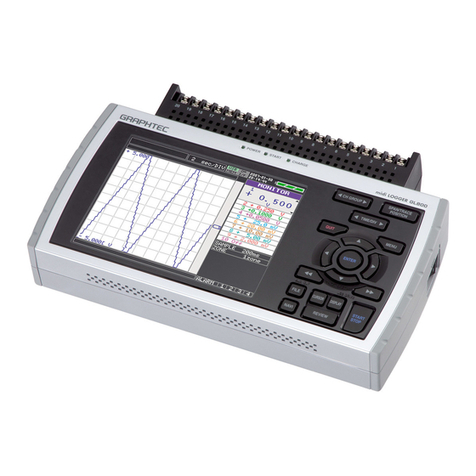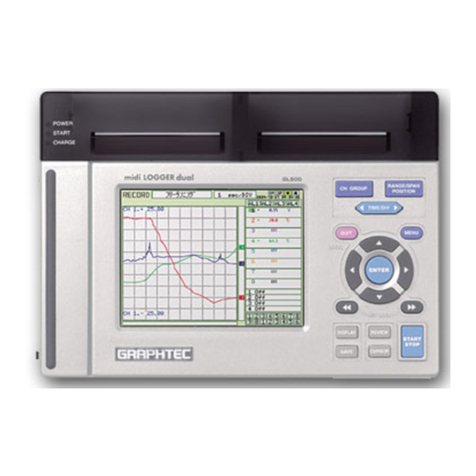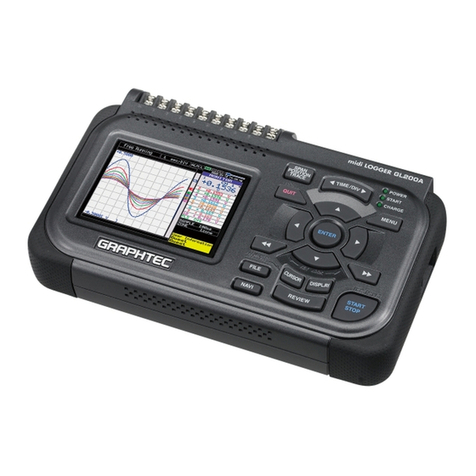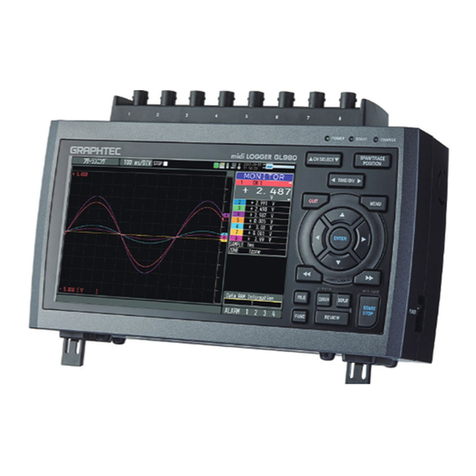
Number of analog input 2
terminal units mountable
Analog input terminal unit input Scanning, all channels isolated
method
Number of analog input 10 channels/unit, 20 channels/unit, 50 channels/unit
terminal channels
Analog voltage input 20, 50, 100, 200, 500 mV; 1, 2, 5, 10, 20, 50 V; 1-5V/f.s.
Temperature input Thermocouples: K, J, E, T, R, S, B, N,W (WRe5-26)
Resistance temperature detector: Pt100, JPt100
Humidity Voltage: 1 V, Scaling conversion: 0V →0%, 1V →100%
Filter On, Off (software filter)
A/D converter 16 bits
Sampling cycle 100, 200, 500 ms; 1, 2, 5, 10, 20, 30 s; 1, 2, 5, 10, 20, 30 min;1 h
Trigger functions Types Start: Data capture starts when a trigger is generated.
Stop: Data capture stops when a trigger is generated.
Conditions Start: Off, Level, Alarm, External, Specified Time
Stop: Off, Level, Alarm, External, Specified Time,Time
Alarm functions Types Analog, Logic, Pulse; AND or OR logic
Conditions Analog: H, L, Window In,Window Out
Logic: 4-ch pattern
Pulse: H, L, Window In,Window Out
Pulse input*1
Number of channels
1 ch
Ranges Revol. mode:500 rpm, 5, 50, 500 krpm/f.s.(max.50k/s)
Counts mode: 50, 500 kC, 5, 50, 500 MC/f.s. (max.50k/sampling cycle)
Inst. mode: 50, 500 kC, 5, 50MC/f.s.(max.50k/sampling cycle)
External trigger input*11 ch
Logic input*14 ch
Alarm output
Number of channels
4 ch
Output format Open collector output (100 k( pull-up resistance)
Output conditions Level judgment, window judgment, logic pattern judgment, pulse judgment
Internal memory Memory capacity: 4 MB (2 Mwords)
Memory device PCMCIA card slot:Type 2
PC interfaces USB (Ver. 2.0), Ethernet (10 Base-T, 100 Base-TX)
Monitor Size 4.7-inch STN color LCD
Displayed items Waveforms + digital values, waveforms only, digital values only,
digital values + calculated values
Functions Waveform expansion/compression, Scaling, Calculation, Search
Operating environment Temperature: 0 to 40 C
Humidity: 30 to 80% RH (non-condensing)
Power supply AC adapter (100 to 240VAC, 50/60 Hz)
Options: DC drive (12VDC, 24VDC), Battery pack
External dimensions (approx.) 212 (W) x 152 (D) x 45 (H) mm
Weight (approx.) 770 g*2
LAN cable
USB cable
* Do not insert the
USB cable into the
LAN connector.
*1: Max.input voltage: +24 V, Input threshold voltage: approx.+2.5V, Hysteresis:approx.1V (+2 to +3V)
*2: Excluding the battery and AC adapter; including one 10-channel input terminal unit
OPS022 Software
GL450 Standard Specifications
Starting the Software
Click "Start"→"Programs"→"OPS022" to launch OPS022. Once started, the following
window is displayed.
Connecting to a PC
The GL450 can be connected to a PC via a LAN cable or a USB cable.Click the (1)
"Connect" button on the main screen to display the connection screen. Select "USB" or
"TCP-IP (LAN)" to suit your requirements.
Stopping Data Capture
Click the (4) ""Stop" button to stop the data capture operation.When data capture has
stopped, "Stopped" is displayed at the upper left of the Group tab, and the waveform
changes to the free running status.
PC Review
When data capture has been completed, clicking the (5) "PC Review" button enables the
data captured to the computer to be replayed.
Device Review
Clicking the (6) "Device Review" button enables the data files captured to the GL450 and
the data captured to the PCMCIA card inserted in the GL450's card slot to be replayed. If
data was captured via the OPS022 software, the same data is created both at the
computer and at the GL450. Use the data created at the GL450 as backup data.
(A) Open File: Selects a data capture file stored in the computer.
Superimpose/Link: Displays multiple superimposed or linked files.The first file that
was replayed becomes the base.
Convert Then Save: Converts the data between cursors or all the data to binary data
or a CSV file and then saves the data.
Display in Excel: Launches Excel and displays the data between cursors or all
the data in a spreadsheet format (see Note).
Print: Prints the waveform.
Note: Microsoft Excel 2000 or later is required.
(B) XY Between Cursors: Displays the data in the range between the cursors as an XY
waveform.
Calculation: Displays the data in the range between the cursors as
Maximum, Minimum, Average, and P-P values for each channel.
(C) Cursor Information: Displays information for the A and B cursors, and time and level
information for theY axis ranges 1 and 2.
Clicking the "Display Cursors" button enables the A and B
cursors to be moved to the screen that is currently being viewed.
Settings
Click the (2) "Settings" button to display the measurement parameter settings screen for
the GL450. Make the appropriate settings on each tab, and then click "Settings" or "OK" to
complete the setting operation.
Starting Data Capture
When all the measurement conditions have been specified, the GL450 is ready to start
capturing data.
Click the (3) "Start" button to start data capture.
Either "Armed" or "Recording" is displayed at the upper left of the Group tab.
Amp: Used to specify analog, logic, and pulse input, and the input ranges
XY: Used to make the XY waveform settings
Span: Used to specify the display range for analog waveforms
Scaling: Used to make the unit conversion settings
Data: Used to make the sampling interval and capture destination file settings
Alarm: Used to make the alarm output settings
Trigger: Used to make the trigger settings
File: Used for the GL450 PCMCIA card operations
Report: Used for the report file capture settings
Other: Used for other settings such as setting the time and E-mail sending functions
Information: Displays OPS022 and GL450 device information
Note: When using a USB cable, a USB driver must be installed in the PC.
Please see your user's manual for the installation procedure.
• Edit screen
The Edit screen is used to make the settings required for connection
to your computer.
For USB connection, specify the USB ID number.
ForTCP-IP connection, specify the IP address and port number. If
multiple GL450 devices are connected, assign a group number to the
respective devices.
Note:The device name must be entered.
The View mode can be changed during data capture (and also
when measurement is stopped).
• Digital View: Large-size digital values are displayed.
• Meter View:Use this view to check the alarm range and so forth.
• Report View: Report data is displayed in spreadsheet format.
USB
Connection
Method TCP-IP Edit
Connect Dis connect Close
Delete
No.
Name
Necessary
IP Address
Port
USB ID
Group
OK Cancel
AMP XY Span Scaling Data Alarm Trigger File Report Other Information
1-10
CH
Select CH Logic/Pulse Settings Device Number
Pulse
Logic
Line
Color Input
OK Cancel Apply
Range Slope
Line
Color
All CH
Analog AMP Settings
Line
Color Annotation Input Range Filter Unit
11-20 21-30 31-40 41-50 51-60 61-70 71-80 81-90 91-100 1 2 3 4 5 6 7 8 9 10
Group1
Waveform View
Y-TX-Y Single View Dual View
Digital View Meter View Report View
Connect Review PC Print EXIT
Settings Start Stop Review Device
Group1
Waveform View
Y-T X-Y Single View Dual View
Digital View Meter View Report View
(1) (5) (2) (3) (4) (6)
Open File
Y Axis Range1 Y Axis Range2 Width
Connect and
Overwrite Convert
then Save Display in Excel Print Close
Start Time Capture Time Interval
Comments
Cursor Status
Trace
XY between
corsor Calc
Cursor Display
(A) (B)
(C)

