Chapter 1: Installation and Safety Information
Safety Considerations
Laser Safety
The Center for Devices and Radiological Health (CDRH) was established in October 1982, by the
U.S. Food and Drug Administration (FDA) to protect the public health in the fields of medical
devices and radiological health
Manufacturers of products subject to performance standards under the Radiation Control for Health
and Safety Act of 1968 are required to furnish various reports to the CDRH.
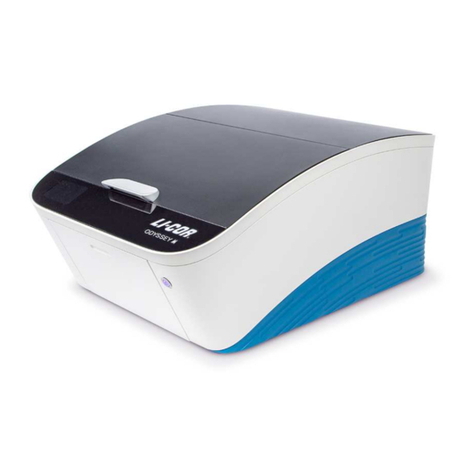
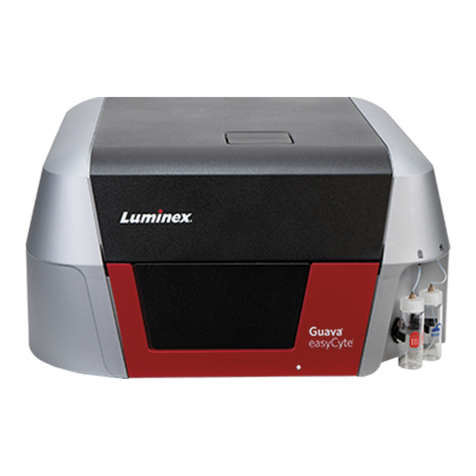
The Odyssey CLx is certified as a Class I laser product. This means that hazardous laser radiation is
not emitted outside the instrument. Radiation emitted inside the Odyssey CLx is confined within
protective housings and external covers. A series of safety interlocks ensures that the laser beam
cannot escape during any phase of user operation.
The CDRH implemented regulations for laser products on August 1, 1976 (CDRH radiation
performance standard 21, Code of Federal Regulations Chapter 1, Subchapter J). Compliance for
products marketed in the United States is mandatory. The label that must be attached to laser
products marketed in the United States is illustrated in Figure 3-2 and is located on the rear panel of
the Odyssey® CLx, indicating compliance with CDRH regulations.
WARNING: Use of controls or adjustments or performance of procedures other than those
specified herein may result in hazardous radiation exposure.
AVERTISSEMENT: L'utilisation des commandes ou le réglage ou la performance des procédures
autrement qu'il a été indiqué dams le présent texte peut résulter en de dangereuses expositions aux
radiations.
The manufacturer label is illustrated in Figure 3-1 and is also on the rear panel of the instrument.
The Odyssey CLx Infrared Imaging System contains two lasers; one emitting at 785 nm, and one at
685 nm. The 685 nm laser emits visible laser radiation - direct exposure to either beam may cause
eye damage. Laser radiation is emitted through apertures at the top of the Odyssey CLx microscope
assembly. Because the microscope assembly moves in both planes relative to the glass scanning
surface, laser radiation could be focused at any position on this surface. Safety interlocks (described
below) automatically turn the lasers off when the Odyssey CLx lid is opened.
The label shown in Figure 3-3 is affixed to the inside of the Odyssey CLx case at two locations; one
near the laser/microscope assembly scanning bed, and the second on the cover that is used to seal
the above mentioned assembly.
Odyssey® CLx
Imager
Page 9
