RACOM RipEX User manual

DEMO handbook
.
RipEX – Radio modem & Router
.
version 1.0
5/6/2013
fw 1.2.x.x
www.racom.eu
RACOMs.r.o. •Mirova1283•59231NoveMestonaMorave•CzechRepublic
Tel.:+420565659511•Fax:+420565659512•E-mail: racom@racom.eu


Table of Contents
1. RipEX – Live Demo ......................................................................................................................... 5
1.1. Introduction ........................................................................................................................... 5
1.2. General Overview ................................................................................................................. 5
1.3. Wizard Configuration ............................................................................................................ 6
1.4. Practical Tests ...................................................................................................................... 6
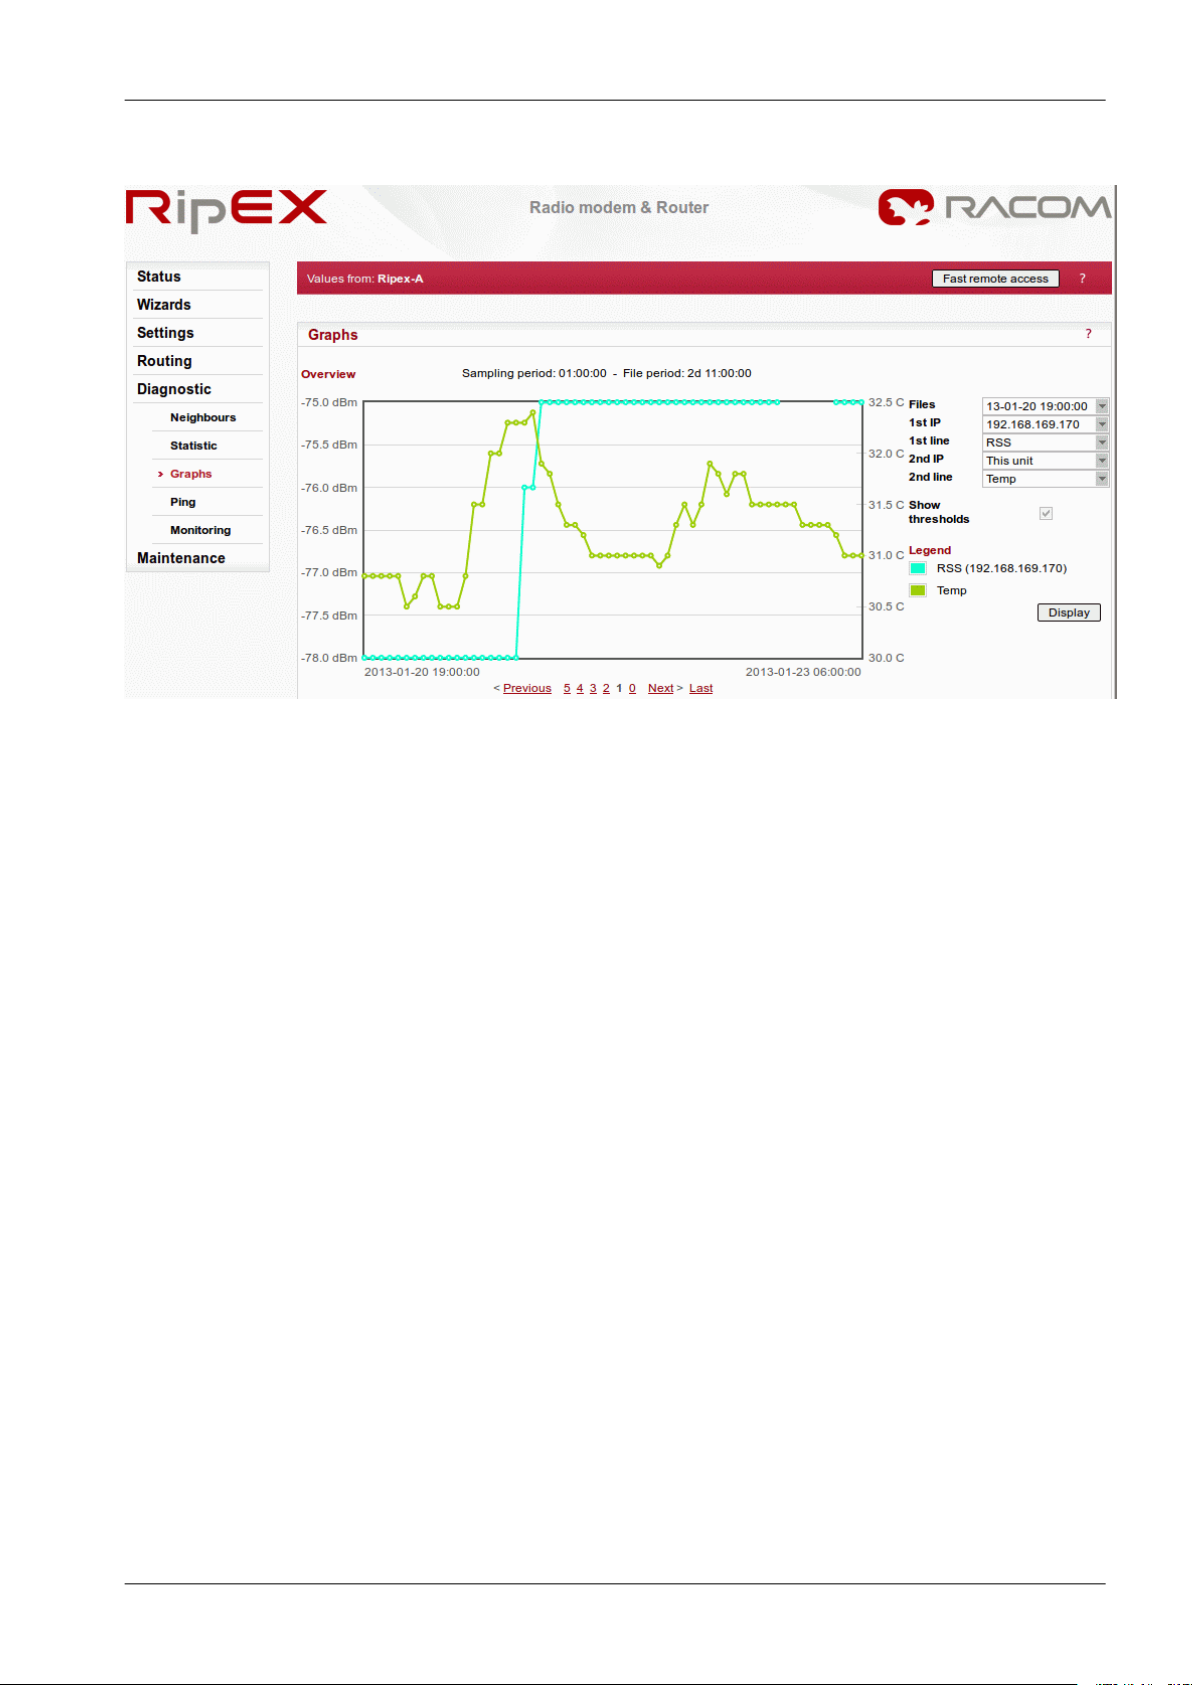
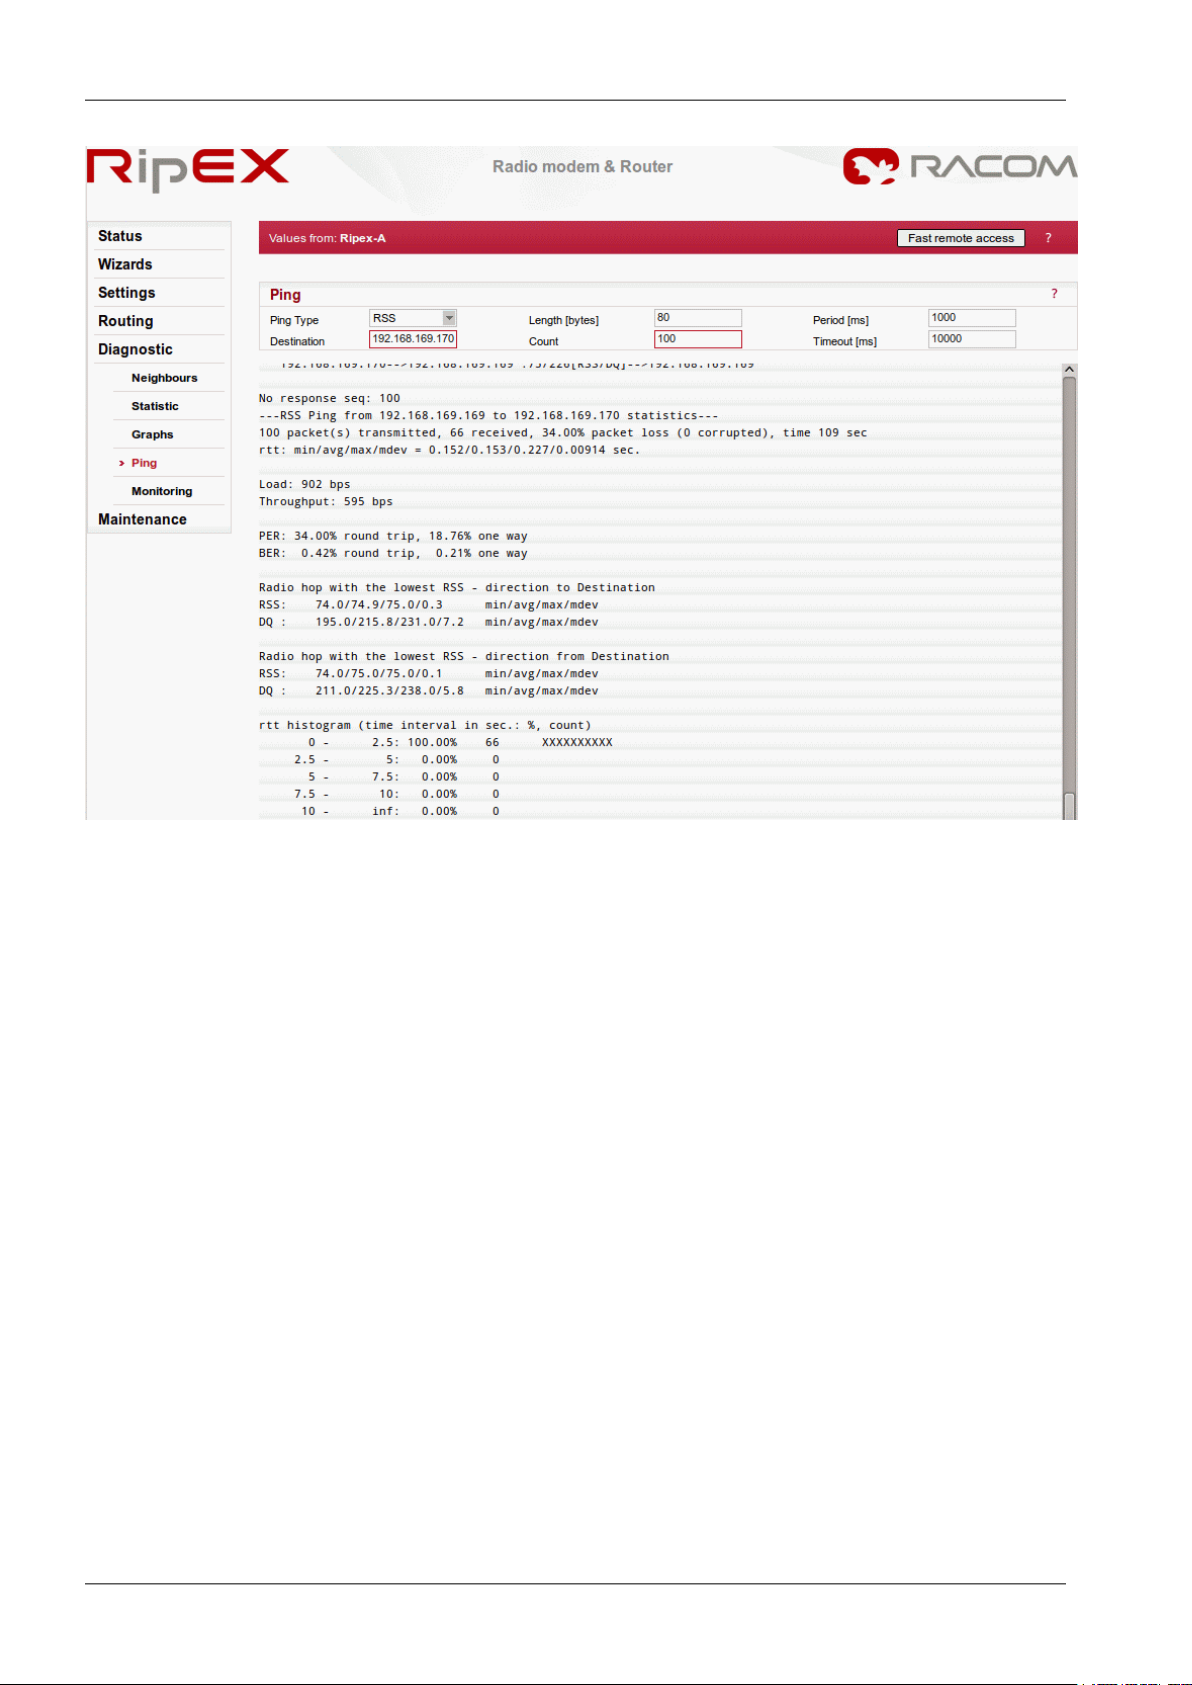
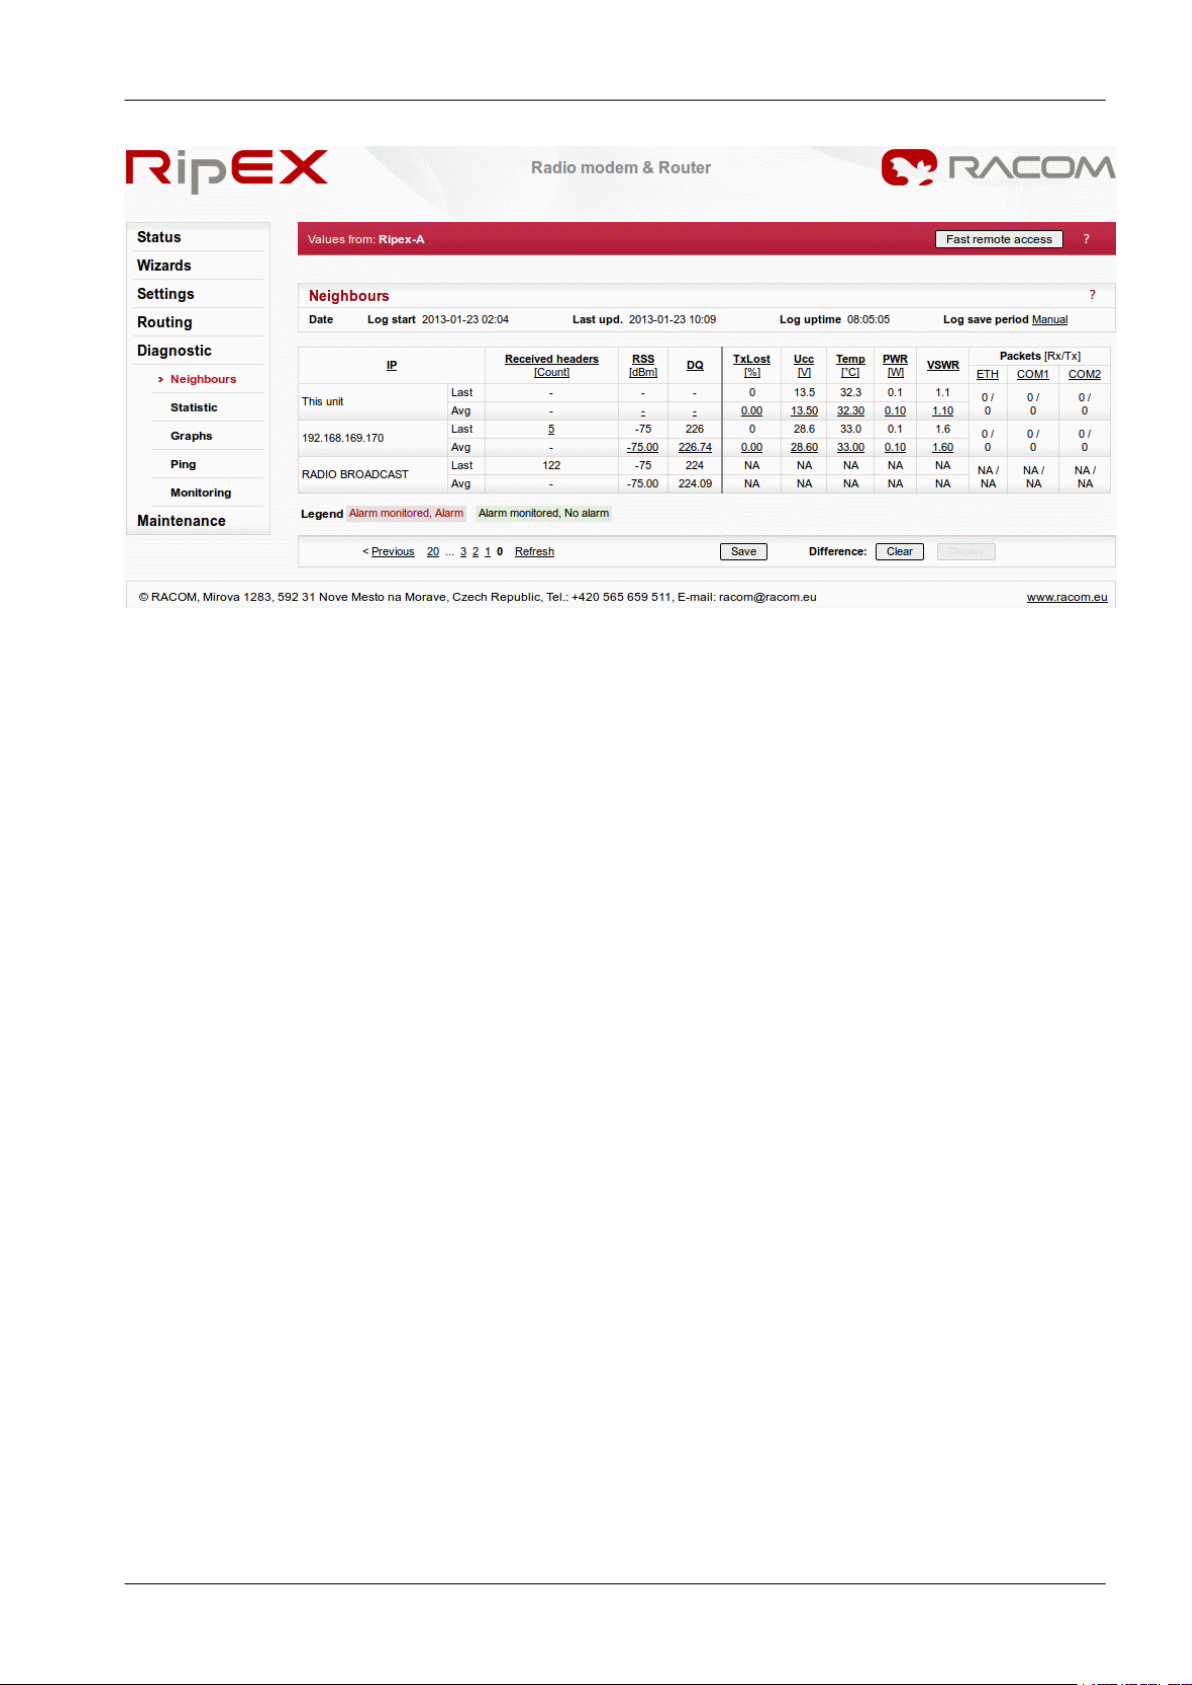
1.5. Diagnostic ............................................................................................................................. 8
1.6. Summary ............................................................................................................................ 12
2. ZABBIX – Live DEMO ................................................................................................................... 13
2.1. Introduction ......................................................................................................................... 13
2.2. Zabbix Overview ................................................................................................................. 13
2.3. Zabbix Live Demo .............................................................................................................. 14
2.4. Summary ............................................................................................................................ 21
3. Demo Case – RipEX & M!DGE ..................................................................................................... 23
3.1. Introduction ......................................................................................................................... 23
3.2. Demo Case ........................................................................................................................ 24
3.3. Programming RipEX via Computer .................................................................................... 24
3.4. RipEX General Overview ................................................................................................... 28
3.5. RipEX Wizard Configuration ............................................................................................... 28
3.6. RipEX Practical Tests ......................................................................................................... 30
3.7. RipEX Diagnostic ............................................................................................................... 38
3.8. RipEX Advanced Tests ....................................................................................................... 42
3.9. M!DGE General Overview .................................................................................................. 43
3.10. Accessing M!DGE ............................................................................................................ 43
3.11. Basic M!DGE Configuration .............................................................................................. 45
3.12. Practical Tests .................................................................................................................. 49
3.13. M!DGE Advanced Tests ................................................................................................... 55
3.14. Summary .......................................................................................................................... 56
3© RACOM s.r.o. – RipEX – Radio modem & Router

4

1. RipEX – Live Demo
1.1. Introduction
RipEX Live demo should answer most of your questions regarding the RipEX product and give you a
quick and easy summary about the product itself.
There are two RipEX units connected to each other via a radio channel available 24/7 for testing. The
units are set to factory settings every day at 02:00 GMT. Each access password is valid for one week
and is changed every Monday at 02:00 GMT. The login name remains the same.
You may access RipEX live demo units on the following IP addresses:
• RipEX-A: https://89.190.53.163:8001
• RipEX-B: https://89.190.53.163:9001
If you do not have the login credentials yet, feel free to contact us using the following link:
http://www.racom.eu/eng/products/remote-access.html#load%28product=ripex%29
RipEX Live demo settings have the following minor changes compared to RipEX factory settings:
•Unit names – RipEX-A and RipEX-B
•Ethernet IP addresses – 192.168.169.169 and 192.168.169.170
•Modulation rate – 20.83 Kbps (4CPFSK)
•RX/TX frequency – 448.250 MHz
1.2. General Overview
RipEX Live demo gives you the most straightforward way to discover and understand all RipEX features
and functionalities. Pay attention to the Settings tab, where one can set most configuration parameters.
A few clicks will give you an easy summary about the product faster than reading many pages of text.
5© RACOM s.r.o. – RipEX – Radio modem & Router
RipEX – Live Demo

For detailed parameter descriptions, click on the Help button. Kindly note, balloon tips are also available
for some parameters.
Keep in mind that accessibility of some parameters depends on the settings of other parameters. For
example serial SCADA protocols on COM ports can only be set when Operating mode is set to the
Router mode.
Fig. 1.1: Help question marks and balloon tips
1.3. Wizard Configuration
The easiest procedure to configure the units in real usage is to use our Wizard feature. Click on the
Wizard tab to be guided through all necessary settings. The Wizard will provide you with helpful notes
for respective parameters.
1.4. Practical Tests
Since the best way to understand the product is through practice, we have described a few practical
tests you may wish to conduct.
1.4.1. Ping
Ping is the basic tool for checking connectivity between two hosts with IP addresses. Because RipEX
is a native IP device, ping can also be used for radio link testing.
RipEX – Radio modem & Router – © RACOM s.r.o.6
RipEX – Live Demo

Go to the Ping tab in the Diagnostic menu. You can either set the Ping Type to „ICMP“ (common ping)
or to „RSS“. The RSS type is a RipEX proprietary ping with extended reports.
The destination is the remote RipEX's IP address. For example when you are locally connected to
RipEX-A (192.168.169.169), fill in 192.168.169.170 and vice versa.
When Ping is started, you will see the following on-line report on your screen.
Fig. 1.2: Ping on-line report
When the specified count of ping packets is transmitted, following detailed summary is displayed. It
consists of: throughput usage, PER/BER, RSS, Data Quality (DQ) and Round Trip Time (RTT) histogram.
It can be very useful during RipEX unit installation and coverage optimisation.
Please read the detailed Ping report description by clicking on the Help question mark.
7© RACOM s.r.o. – RipEX – Radio modem & Router
RipEX – Live Demo

Fig. 1.3: Detailed Ping report
Feel free to change the packet length (Ping option) or the Modulation rate (Settings tab) in order to see
the impact on the measured RTT. Do not forget to set the same Modulation rate in both units.
1.5. Diagnostic
RipEX web interface is equipped with comprehensive and detailed statistics and graphs. One could
say, there is an embedded NMS (Network Management System) within RipEX.
Every RipEX can broadcast its Watched values to other reachable RipEX units within the network.
Among these Watched values are: current supply voltage, internal temperature, RF output power,
Voltage Standing Wave Ratio on the antenna feed line, packet counters on separate interfaces and
other values.
1.5.1. Neighbours
These Watched values are displayed in the Diagnostic → Neighbours menu. See the following example
with one neighbouring unit.
RipEX – Radio modem & Router – © RACOM s.r.o.8
RipEX – Live Demo

Fig. 1.4: Neighbours menu
1.5.2. Statistic
The Diagnostic → Statistic menu provides you with information about data volume on all interfaces:
Radio, Ethernet, COM1 and COM2. The menu displays the number of received and transmitted packets,
their sizes and current throughput. Moreover, a detailed division into user and service packets is
available for the radio channel.
The quick value descriptions are displayed in the balloon tips (place the cursor on any column header).
The detailed description can be read in the respective Help.
9© RACOM s.r.o. – RipEX – Radio modem & Router
RipEX – Live Demo

Fig. 1.5: Statistic menu
1.5.3. Graphs
Neighbours and Statistic values can also be displayed as graphs in the Diagnostic → Graphs menu.
Each graph is available in a summary or detailed version and can display two different elements at
once. The detailed graphs can be created continuously or can be triggered whenever monitored values
are out of their threshold ranges. Each graph can be created based on the values of the unit itself or
any other neighbouring unit.
The detailed Graphs description can be read in the respective Help.
RipEX – Radio modem & Router – © RACOM s.r.o.10
RipEX – Live Demo

Fig. 1.6: Graph menu
1.5.4. Monitoring
Monitoring is an advanced on-line diagnostic tool, which enables detailed communication analysis over
any RipEX interface. In addition to all physical interfaces (Radio, Ethernet, COM1 and COM2), several
internal interfaces between software modules can be monitored.
Go to the Diagnostic → Monitoring menu and just click on the Start button. In the default settings, it
will display packet timing and payload on the Radio channel.
For example, you can test Monitoring while performing the Ping test .
Note: In order to see both on-line reports (Ping as well as Monitoring), start Ping in a new independent
window or panel in your browser.
11© RACOM s.r.o. – RipEX – Radio modem & Router
RipEX – Live Demo

Fig. 1.7: Monitoring the ping packets in two separate windows
1.6. Summary
We have described just a few examples of Live demo usage. Feel free to download the RipEX User
manual from http://www.racom.eu/download/hw/ripex/free/eng/ripex-m-en.pdf or the Application notes
from http://www.racom.eu/download/hw/ripex/free/eng/ripex-app-en.pdf to conduct further tests.
Do not hesitate to contact us if you have any questions:
RACOM technical support team
E-mail: <[email protected]>
Tel.: +420 565 659 511
RipEX – Radio modem & Router – © RACOM s.r.o.12
RipEX – Live Demo

2. ZABBIX – Live DEMO
2.1. Introduction
RACOM has many years of experience with Network Management System (NMS) – 15 years ago
we started to build our own proprietary NMS called RANEC. RANEC is built upon similar principles like
today's NMS. It was optimized to be used within narrow bandwidth radio networks so the customers
could get all the valuable information about the network.
The NMS development and customer requirements to integrate our proprietary solution into their NMS
have led us to implement Simple Network Management Protocol (SNMP) support for all the new
generation RACOM products.
Many RACOM customers use their own NMS, in which they need to manage our products. We can
offer them this opportunity with general SNMP implementation. The following text is intended for all
customers who are searching for the network management system applied to the RACOM products.
The text will demonstrate the possibilities of a standardised NMS.
Almost any NMS can be used for accessing SNMP values. The Zabbix open source monitoring system
was chosen as a demonstration of basic functionalities. We have prepared a Zabbix Live demo so
you can browse the Zabbix web interface and see most of the important features.
Tip
Contact our Sales department for the Zabbix Live demo credentials.
Please find more details in the following chapters.
2.2. Zabbix Overview
Zabbix authors provide the following description:
Zabbix is the ultimate open source availability and performance monitoring solution. Zabbix offers ad-
vanced monitoring, alerting, and visualization features today which are missing in other monitoring
systems, even some of the best commercial ones. Below is a short list of features available in Zabbix:
13© RACOM s.r.o. – RipEX – Radio modem & Router
ZABBIX – Live DEMO

•auto-discovery of servers and network devices
•low-level discovery
•distributed monitoring with centralized web administration
•support for both polling and trapping mechanisms
•server software for Linux, Solaris, HP-UX, AIX, FreeBSD, OpenBSD, OS X
•native high performance agents (client software for Linux, Solaris, HP-UX, AIX, FreeBSD, OpenBSD,
OS X, Tru64/OSF1, Windows NT4.0, Windows 2000, Windows 2003, Windows XP, Windows Vista
•agent-less monitoring
•secure user authentication
•flexible user permissions
•web-based interface
•flexible e-mail notification of predefined events
•high-level (business) view of monitored resources
•audit log
For detailed information, see the Zabbix documentation:
• http://www.zabbix.com/documentation.php
You can also read RipEX Application note, Chapter 2: RipEX SNMP Configuration Guide
• http://www.racom.eu/eng/products/m/ripex/app/snmp.html
2.3. Zabbix Live Demo
We believe the Zabbix Live demo will answer most of your questions regarding Zabbix and the SNMP
functionality by giving you a quick and easy summary about all our products themselves rather than
reading many pages of text
This chapter will guide you through essential features which Zabbix offers you with the RACOM
equipment.
2.3.1. Login screen
The Zabbix front-end is available for your testing 24/7. Each access password is valid for one week
and is changed every Monday at 02:00 GMT. The login name remains the same.
You may access Zabbix live demo here: http://89.190.53.163:9005
Login credentials are as follows:
User name: customer
Password: Contact your respective sales manager or our Sales department (<[email protected]>)
Feel free to go through all the menus. The user access is read-only. You cannot change any configur-
ation parameters.
RipEX – Radio modem & Router – © RACOM s.r.o.14
ZABBIX – Live DEMO

Fig. 2.1: Zabbix login screen
2.3.2. Dashboard
Personal Dashboard is displayed after you login. With full-access you would be able to change the
layout as you wish.
On the following picture, you can see that NMS monitors two RAy units, two RipEX units and two GPRS
units (M!DGE and MG102). Zabbix is monitoring itself too.
Several triggers were defined to display the warning if any unit is in the undesired state (e.g. modem
temperature is too high, RSS level is out of the threshold range, etc.). In our example, there are two
events with RAy10-H (RSS and SNR values) and one event with MG102 (VPN deactivation).
On the left side Zabbix menu, you can add favourite graphs,screens and maps. We provide several
examples which are described in the following sections.
The main Zabbix navigation bar is at the top of the screen.
15© RACOM s.r.o. – RipEX – Radio modem & Router
ZABBIX – Live DEMO

Fig. 2.2: Dashboard
2.3.3. Latest Data
You can see all monitored values of all monitored units in this menu. On the following example, Zabbix
displays M!DGE WWAN statistics (e.g. current signal strength, Local Area Identification – LAI, …).
We provide many values which can be obtained from our products. Just go through all of them to see
the details.
For every value, Zabbix provides its history. If the value is numerical, there is also a graph. The history
values are stored in MySQL database for a defined time period.
Note
You can use a different database engine in your Zabbix installation.
RipEX – Radio modem & Router – © RACOM s.r.o.16
ZABBIX – Live DEMO

Fig. 2.3: Latest data
2.3.4. Graphs
Each numerical monitored value can be displayed as a graph and in every graph, there can be more
values displayed.
You can define various colours, types of lines, legends and other parameters. You can also change
the time period of the displayed graph.
17© RACOM s.r.o. – RipEX – Radio modem & Router
ZABBIX – Live DEMO

Fig. 2.4: Graphs
2.3.5. Screens
You can define comprehensive screens with many graphs displayed on a single page.
In the example below, we have RAy10-H graphs. We can easily display the same graphs for the second
RAy unit. You can also display graphs for both units within a single screen.
RipEX – Radio modem & Router – © RACOM s.r.o.18
ZABBIX – Live DEMO

Fig. 2.5: Screens
2.3.6. Maps
Zabbix offers the possibility to display user-defined maps. You can upload any background image and
insert any unit on this map. For each unit, you can display various statistics and you can see each
unit's status.
In our example, there are two linked RipEX units with temperature, RSS and DQ values. The background
image is the raster map of Nové Město na Moravě.
Note
Any user-defined icon can be imported into the Zabbix, which can be coloured according
to unit status.
19© RACOM s.r.o. – RipEX – Radio modem & Router
ZABBIX – Live DEMO

Fig. 2.6: Maps
2.3.7. Overview
The overview menu gives you a quick summary of the states of all or selected units.
In this example, you can see the same issues as on the dashboard screen – MG102 VPN deactivation
and RAy RSS/SNR values. All other monitored values are OK (e.g. values are within the defined
threshold ranges) and are displayed with a green colour.
You can also display the values as in the Latest data menu.
RipEX – Radio modem & Router – © RACOM s.r.o.20
ZABBIX – Live DEMO
Other manuals for RipEX
2
This manual suits for next models
2
Table of contents
Other RACOM Radio Modem manuals

RACOM
RACOM RipEX 1.12.0 User manual

RACOM
RACOM RipEX2 User manual

RACOM
RACOM RipEX User manual

RACOM
RACOM RipEX 1.5 User manual

RACOM
RACOM RipEX 1.3 User manual

RACOM
RACOM RipEX 1.12.2 User manual

RACOM
RACOM RipEX 1.4 User manual

RACOM
RACOM RAy3 User manual

RACOM
RACOM RipEX2 User manual

RACOM
RACOM ECONOMY RE400 User manual