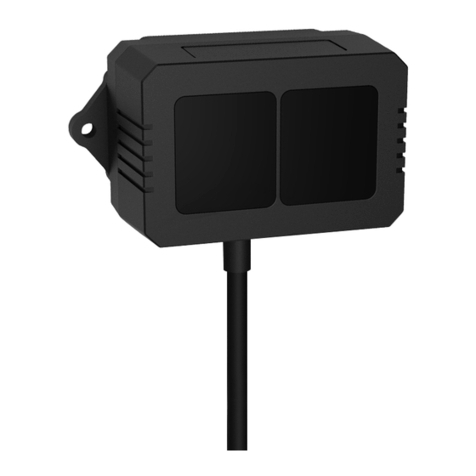
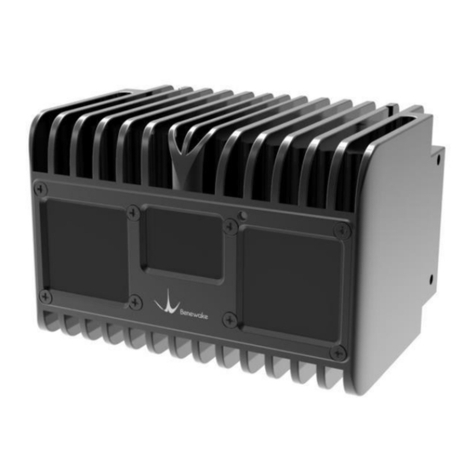
Benewake CE30-C User manual

Page 1
CE30-C Solid State Array LiDAR
Operation Manual

Page 2
Table of Contents
1. Introduction...........................................................................................................................................................3
2. Accuracy Test........................................................................................................................................................4
3. Operation of Windows Display Program..............................................................................................................5
3.1. Connection ................................................................................................................................................6
3.2. Display ProgramWindows........................................................................................................................7
3.3. Deactivation ..............................................................................................................................................9
4. Indicator ................................................................................................................................................................9
5. Line Sequence.....................................................................................................................................................10
6. Installation Schematics........................................................................................................................................10
7. Introduction of SDK............................................................................................................................................10
7.1. Descriptions of SDK ...............................................................................................................................10
7.2. Output Data.............................................................................................................................................12
8. Cooler and Reference Design..............................................................................................................................13
9. Influence Factors of Measurement......................................................................................................................14
9.1. Multi Optical Path...................................................................................................................................14
9.2. Stray Light...............................................................................................................................................15
9.3. Multi Distance Objects............................................................................................................................15

Page 3
1. Introduction
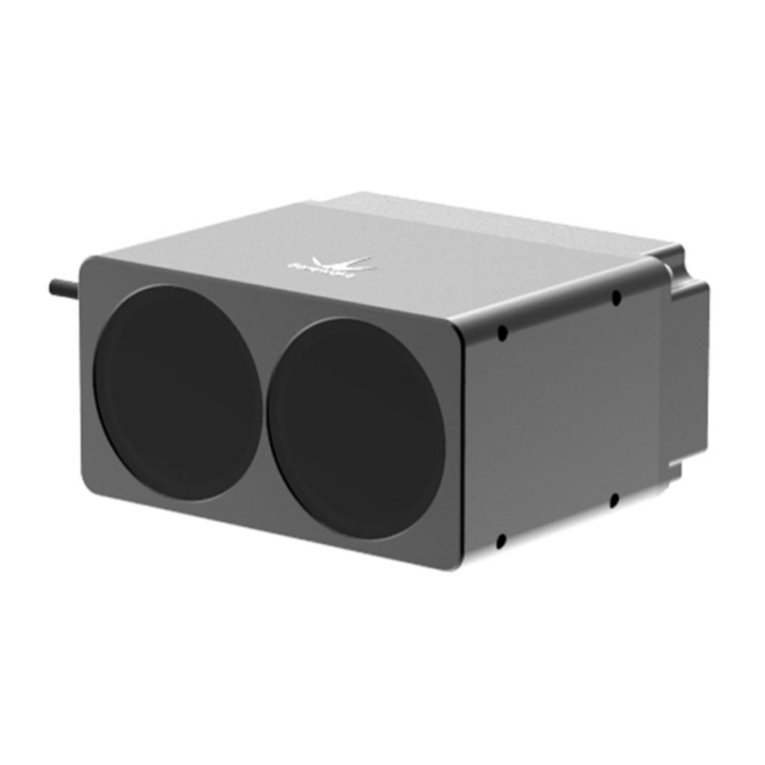
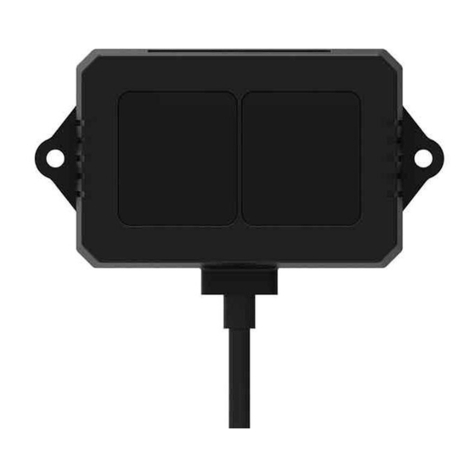
CE30-C is an infrared LiDAR developed on the basis of ToF principle. Compared with scanner LiDAR, CE30-C does
not have any rotating components in the interior, which could ensure the reliability of long-time work and wider vertical
angle.
Figure 1 Outline Dimension Drawing of DE-LIADAR CE30

Page 4
Figure 2 Dimension and Installation Drawing of CE30-A LiDAR Components - Heat Sink
2. Accuracy Test
Figure 3 Accuracy test environment and devices
The test is made under the condition of no ambient light. Due to the automatic temperature compensation function of the
CE30-C, no preheating of the machine is required before the test. The CE30-C is mounted on an automatic test car that

Page 5
moves along a guide rail and has a displacement accuracy of 1 cm. CE30-C detects the white board of 90% reflectivity,
collects 50 frames of data every 10cm. The center 24*24 pixels area’s data is selected for statistical analysis.
CE30-C’s accuracy is defined as the difference between the average value of a 24*24 pixels area in the center of the field
of view and the true distance value.
Figure 4 Accuracy of the center 24*24 pixels area
CE30-C’s repeatability is defined as the standard deviation of the average value of a 24*24 pixels area in the center of
the field of view.
Figure 5 Repeatability if the center 24*24 pixels area
3. Operation of Windows Display Program
This display program is used for processing and displaying of output data from CE30-C LiDAR in Windows operating system.
Please check integrity of files necessary for running before using:
Figure 6 Windows Display Program and Files Necessary for Running
-2.0
-1.0
0.0
1.0
2.0
3.0
4.0
5.0
35 45 55 65 75 85 95 105 115 125 135 145 155 165 175 185 195 205 215 225 235 245 255 265 275 285 295 305
Difference (cm)
Distance (cm)
Accuracy of the Center Field of View
0.0
0.5
1.0
1.5
2.0
2.5
3.0
35 45 55 65 75 85 95 105 115 125 135 145 155 165 175 185 195 205 215 225 235 245 255 265 275 285 295 305
Standard Deviation (cm)
Distance (cm)
Repeatability of the Center Field of View

Page 6
3.1. Connection
Figure 7 Illustration for Connection of Components
Connect power supply line and Ethernet line and set IP address and subnet mask under the directory Control
Panel\Network and Internet\Network and Internet Connections as shown in Figure 8 below.
Figure 8 Network Setting
To check whether connect is set correctly, start a Command Prompt via Run dialog window and execute command:
ping 192.168.1.80
If the information as shown in Figure 9 appears, this indicates LiDAR is connected correctly and working.
Figure 9 Check of Data Connection

Page 7
3.2. Display Program Windows
Double click CE30_Display.exe to run display program. The four windows as shown in Figure 10 will pop up: Message
Prompt Window, Original Image Window, Undistorted Image Window and Point Cloud Window.
Figure 10 Windows of Upper Computer, From Top to Bottom: Message Prompt Window, Original Image Window,
Undistorted Image Window and Point Cloud Window
3.2.1. Message Prompt Window
This window is used to display LiDAR connection information, Key Help for shortcut keys and other running
information.
3.2.2. Image Window
Display program outputs two depth images simultaneously:
1. Original depth image from LiDAR (Original image): the depth image constructs with direct output data from
LiDAR with field of view 132×9°;
2. Undistorted depth image (Undistorted image): the undistorted depth image corrected by the program with field
of view 112×9°.
Click depth image in both windows, the depth value (in centimeter) of the pixel corresponding to current cursor position

Page 8
will be displayed in the message prompt window, as shown in Figure 11.
Figure 11 Display of Depth Value at Pixel Position
3.2.3. Point Cloud Window
Point Cloud Window shows the point cloud image obtained based on the depth image and projection. In this window,
hold left mouse button and drag to switch viewing direction of point cloud image; use mouse wheel to zoom point cloud
window; use right mouse button to reset observation position of the point cloud window to default angle.
3.2.4. Key Help
Figure 12 Key Help
When launching the program, Key Help for shortcut keys will be printed in the Message Prompt Window, as shown in
Figure 12. Controls by shortcut keys consist of two parts:
1. General control: control and enabling/disabling of general functions of the program.
a) Shortcut A To zoom out point cloud image
b) Shortcut D To zoom in point cloud image
c) Shortcut O To record original & undistorted depth image data and amplitude data. Save the data
under the directory of the program
d) Shortcut P To pause data recording
e) Shortcut H To reprint this Key Help messages in message prompt window.
f) Shortcut Q To deactivate LiDAR and disconnect the program with LiDAR
2. Vision Help:
a) Shortcut Z To adjust point cloud image to top view
b) Shortcut X To adjust point cloud image to left side view
c) Shortcut X To adjust point cloud image to oblique view from upper left
d) Shortcut X To reset observation position to default (default is the position of LiDAR)
Notes: shortcut keys will come into effect only in Original/Undistorted Image Window or Point Cloud Window. When in
Message Prompt Window, they will function to input into program.
Page 9
3.3. Deactivation
Procedures for normal deactivation of LiDAR and display program are:
1. Press “Shortcut Q” in Original/Undistorted Image or Point Cloud Window. The prompt message for
deactivation of LiDAR and disconnection will appear on Message Prompt Window.
2. Press “Enter” key in Message Prompt Window to quit program.
Noted that LiDAR will remain operating and connected with PC terminal if the display program is directly turned off
without using “Shortcut Q”. If the display program is rebooted in this case, it will not operate normally as LiDAR will
not respond to its request for connection and activation. In that case, the LiDAR needs to be directly power off, followed
by reconnection and reboot of the display program.
4. Indicator
Figure 13 Position of Indicator
1. Blue light: ready state, ready for connection and running
2. Blue flash: running state
3. Red flash: missing of relevant running files.
4. Red light: fatal error (signal abnormal, interface communication abnormal, I2C abnormal, etc.)

Page 10
5. Line Sequence
Figure 14 Line Sequence of Power Supply Port: Red - Positive Pole of Power Supply, Black - Negative Pole of Power
Supply
Attention!
1. Current of power adapter shall be above 2A.
2. During energization of LiDAR, there is merely a slim chance of prolonged starting time. If LiDAR is not
started after 2 minutes, it is recommended to deenergize and reboot it.
3. Please make sure to disconnect power supply before other connections.
6. Installation Schematics
Figure 15 Recommendations on LiDAR Installation Location. The front working surface of LiDAR should exceed or at least
be parallel with the installation platform; otherwise, there may be certain interference, further reducing the data accuracy
7. Introduction of SDK
7.1. Descriptions of SDK
SDK is mainly used to develop applications of this LiDAR on Linux system by using C/C++, of which source codes can

Page 11
be referenced for migration & development of applications on other platforms.
1) SDK consists of following file or folders:
examples: examples of using SDK, including source codes and makefile;
include: header files for using SDK;
src: source codes of SDK;
makefile: compile command file for compiling SDK into shared object file (.so file) in Linux system;
README: operation instructions as well as other relevant information and instructions of SDK.
2) Globel variables in SDK:
unsigned short gRawDistMatrix[]: original data obtained from LiDAR, arranged in form of
one-dimensional array;
float gCameraMatrix[9]: internal parameters matrix of LiDAR, arranged in form of one-dimensional array
and in the sequence {f/dx, skew, u0, 0, f/dy, v0, 0, 0, 1};
float gDistCoffs[5]: distortion parameters of LiDAR, arranged in the sequence of {k1, k2, p1, p2, k3}.
3) Methods contained in SDK:
bool initDevice(int &_sd, float *_mapX, float *_mapY, int _height, int _width)
Parameter:
_sd socket handle
_mapX projection map, coordinates along x-axis
_mapY projection map, coordinates along y-axis
_height height of output depth image, should be set to 24
_width width of output depth image, should be set to 320 or 480
In this method, gCameraMatrix [9], gDistCoffs[5], mapX[], mapY[], socket and TCP/IP connection
are initialized. LiDAR is literally put into service by invoking such method. The size of projection map is
set to _height * _width, so as the output depth images' resolution.
When set _width to 320, output depth image has the same aspect ration with device's original output
but only keep a field of view of 102*9 degree; when set _width to 480, output depth image can keep the
max field of vew of 112*9 degree but the left and right edges would be a little blurred.
bool getDistanceData(int _sd, unsigned short *_dst, float *_mapX, float *_mapY, int _height, int
_width)
Parameter:
_sd socket handle
_dst data of undistorted depth image
_mapX projection map, coordinates along x-axis
_mapY projection map, coordinates along y-axis
_height the height of ROI in pixels, cannot be bigger than 24
_width the width of ROI in pixels, cannot be bigger than 480
In this method, original data from LiDAR is accessed and saved in gRawDistMatrix[]. Also the

Page 12
undistorted depth image is output from _dst. A frame of depth image (sized _h * _w, max size 480*24) is
output every time this method is called.
bool closeDevice(int &_sd)
Parameter:
_sd socket handle
In this method, the LiDAR is deactivated and TCP/IP is disconnected.
For details, please refer to sample program and codes in examples
7.2. Output Data
Figure 16 Illustration of Data Arrangement
The depth image of maximum 480*24 is outputted from the SDK in unit of frame. The data is arranged in form of
one-dimensional array. The sequence is from left to right and top to bottom, with the pixel in the upper left corner of the
image as the origin. Output along X axis, then Y axis, the following output sequence will be generated as shown in the
figure above:
(X,Y) : (0,0) (1,0) (2,0) (…,0) … (0,1) (1,1) (2,1) (…,1) … (0,2) (1,2) (2,2) (…,2) … (0,…) (1,…) (2,…) (…,…) …
For the distance from detected object to the plane of camera, it is expressed in cm by each pixel through the data format
of 16-bit unsigned short int.

Page 13
Figure 17 Projection Relation Diagram
Generally the origin point 𝑂𝑐of camera coordinate system is considered to coincide with origin point 𝑂𝑤of world
coordinate system. As such, a point m (𝑢,𝑣) in depth image can be transferred into 3D space point M (𝑋𝑤,𝑌𝑤,𝑍𝑤) by
following equations:
{𝑋𝑤= 𝑍𝑐∙ (𝑢 − 𝑢0)∙𝑑𝑥/𝑓
𝑌𝑤= 𝑍𝑐∙ (𝑣− 𝑣0)∙𝑑𝑦/𝑓
𝑍𝑤=𝑍𝑐
Where
𝑍𝑐output value of each pixel
𝑢0the x-coordiante of depth image’s center
𝑣0the y-coordiante of depth image’s center
𝑑𝑥size of pixel along x-axis
𝑑𝑦size of pixel along y-axis
𝑓focal distance of lens, 𝑑𝑥/𝑓 = 1 / gCameraMatrix[0], 𝑑𝑦/𝑓 = 1 / gCameraMatrix[4]
8. Cooler and Reference Design
In normal operation, the CE30 LiDAR has an average heat power consumption of around 5W. As shown below is the
reference design of heat dissipation component of CE30 LiDAR. Users have the option to design heat dissipation
component depending upon actual installation requirements and application scenario.

Page 14
Figure 18 Optional cooler Components
9.
9. Influence Factors of Measurement
9.1. Multi Optical Path
Based on ToF LiDAR principle, if there are multiple echo regions as shown in the figure below at the working height of
the radar, the multi-path phenomenon will be triggered: the LiDAR receives the light returned by the path 1 and the path
2 at the same time, which may result in a larger measurement value.
Figure 19 Multi optical path phenomenon

Page 15
9.2. Stray Light
As shown below, when solid-state ToF LiDAR is working, in addition to the light reflected by the object 1, the light
scattered by object 2 and object 3 that close to the LiDAR will enter the lens. Such stray light can lead to a deviation of
the object 1’s ranging.
Figure 20 Illustration of stray light
9.3. Multi Distance Objects
Figure 21 Multi distance objects
The light radiated by the LiDAR is reflected by the object onto the sensor of the LiDAR. If some pixels receive signals
from both front and rear obstacles at the same time, the output distance of this pixel may be the value between the two
obstacles. The degree of deviation is related to the distance between the two obstacles and the material.
Other manuals for CE30-C
1
Table of contents
Other Benewake Accessories manuals

Benewake
Benewake TF350 User manual

Benewake
Benewake CE30-D User manual

Benewake
Benewake TF03 User manual

Benewake
Benewake TFmini-i User manual

Benewake
Benewake TF02-Pro User manual

Benewake
Benewake TF03 User manual

Benewake
Benewake TF350 User manual

Benewake
Benewake TF350-RS-485 User manual

Benewake
Benewake TF02-Pro-W-485 User manual

Benewake
Benewake TF02-Pro-W-485 User manual
Popular Accessories manuals by other brands

PCB
PCB TORKDISC 5309D-02A Installation and operating manual

MADRIX
MADRIX USB light sensor Quick start guide & technical manual

3B Medical
3B Medical Lumin LM3000 user manual

Muji
Muji AD-SD1-IN user manual

Stiga
Stiga FLEXI TRAINER W150 Assembly & instruction manual

Lightolier
Lightolier IS-CL instruction sheet