manuals.online logo
Brands
  1. Home
  2. •
  3. Brands
  4. •
  5. BRUEL & KJAER
  6. •
  7. Measuring Instrument
  8. •
  9. BRUEL & KJAER 2031 User manual

BRUEL & KJAER 2031 User manual

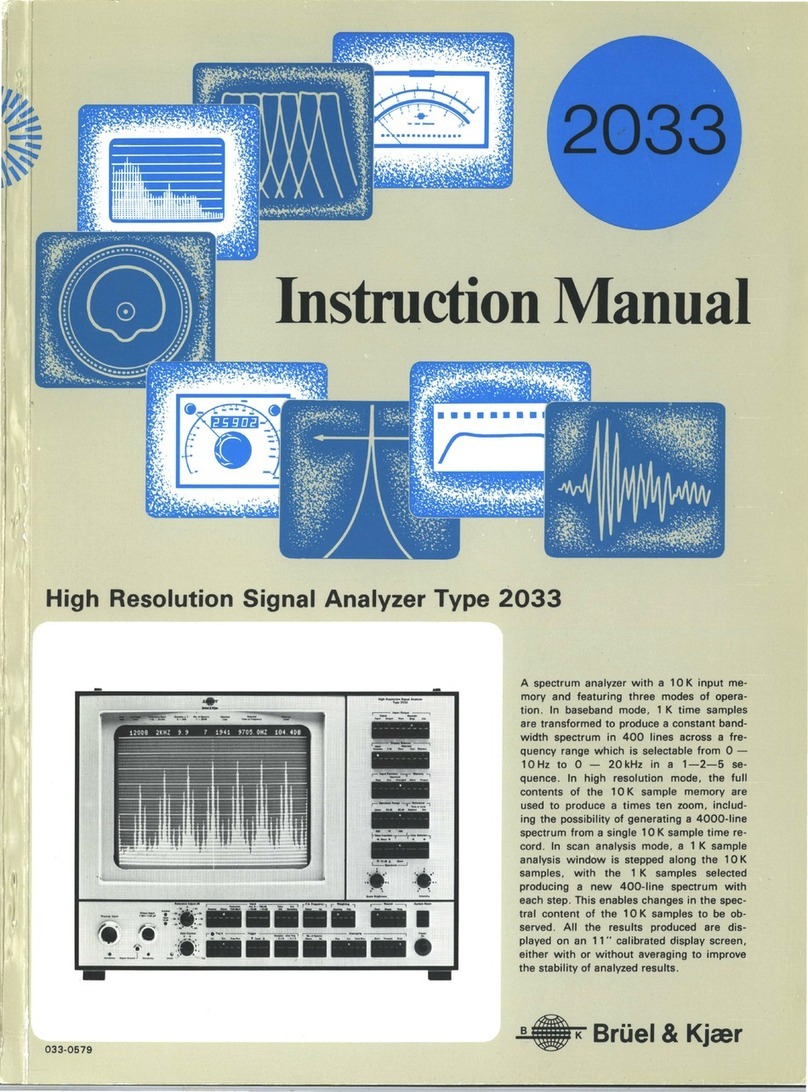
Instruction
Manual
2031
Narrow
Band Spectrum Analyzer Type
2031
033-0267 .
A
narrow
band spectrum analyzer featuring·
almost entirely digital construGtion. The
spectral analysis takes place in
400
con-
stant bandwidth lines across a frequency
range
which
is selectable from
0-
10Hz
to
0-
20kHz
in a
1-2-5
sequence, and ex-
tensive
transient
recording facilities make
the
2031
equally
at
home
with
continuous
and impulsive signals. The analysis takes
place in real-time
for
all frequency ranges
up to
0-
2kHz.
The results produced can
be exponentially or linearly averaged prior
to display on an
11"
calibrated display
screen,
which
may also be used
to
show
the
time
function,
the
instantaneous spec-
trum,
and a hold max. spectrum.
+
BrUel
&
Kjcer
BROEL &
KJ~R
instruments cover the
whole
field of sound and vibration measurements.
The main groups are:
ACOUSTICAL
MI;ASUREMENTS
Condenser
Microphones
Piezoelectric Microphones
Microphone
Preamplifiers
Hydrophones
Sound Level
Meters
Precision Sound Level
Meters
Impulse Sound Level
Meters
Noise Dose
Meters
Noise Level Analyzers
Standing Wave Apparatus
Calibration Equipment
Reverberation Processors
Sound
Sources
ACOUSTICAL
RESPONSE TESTING
Sine
Generators
Random Noise Generators
Sine-Random Generators
Artificial
Voices
Artificial
Ears
Artificial
Mastoids
Hearing
Aid
Test Boxes
Audiometer Calibrators
Telephone
Measuring
Equipment
Audio
Reproduction Test Equipment
Tapping
Machines
Turntables
VIBRATION
MEASUREMENTS
Accelerometers
Force Transducers
Impedance Heads
Accelerometer Preamplifiers
Vibration
Meters
Accelerometer Calibrators
Magnetic
Transducers
Capacitive Transducers
Complex
Modulus
Apparatus
Bump
Recorders
VIBRATION TESTING
Exciter
Controls-
Sine
Exciter
Controls-
Sine-
Random
Exciter Equalizers, Random or Shock
Exciters
Power
Amplifiers
Programmer Units
Stroboscopes
STRAIN
MEASUREMENTS
Strain
Gauge Apparatus
Multipoint
Selectors
MEASUREMENT
AND
ANALYSIS
Voltmeters
Phase
Meters
Deviation Bridges
Measuring
Amplifiers
Band-Pass Filter Sets
Frequency Analyzers
Real Time Analyzers
Heterodyne Filters and Analyzers
Distortion
Measuring
Equipment
Psophometers
Statistical Distribution Analyzers
Tracking Filters
RECORDING
Level Recorders
Frequency Response Tracers
Tape Recorders
Alphanumeric
Printers
Digital Event Recorders
DIGITAL
EQUIPMENT
Computers
Tape Punchers
Tape Readers
Bruel
&
Kjcer
DK-2850 NJERUM, DENMARK ·
Telephone:
+ 45 2 80 05 00 ·
Telex:
37316
bruka
dk
1
Instruction
Manual
2031
Narrow
Band Spectrum Analyzer Type
2031
033-0267 .
'I
r
---~--..-
..
•:
..
" . ·
•·
··
wr·
A
narrow
band spectrum analyzer featuring
almost entirely digital construction. The
spectral analysis takes place in
400
con-
stant bandwidth lines across a frequency
range
which
is
selectable from
0-
10Hz
to
0-
20kHz
in a
1-2-5
sequence, and ex-
tensive transient recording facilities make
the
2031
equally at home
with
continuous
and impulsive signals. The analysis takes
place in real-time for all frequency ranges
up to
0-
2kHz. The results produced can
be exponentially or linearly averaged prior
to
display on an
11"
calibrated display
screen,
which
may also be used
to
show
the
time
function, the instantaneous spec-
trum
, and a hold max. spectrum.
+ BrUel &Kjrer
"'r
q··
L
~-
--
--
-- , - -
-~
--~--
--
-!
~
'~-
-
-
- - - -
--
·-
- - - - - -
.../
NARROW
BAND
SPECTRUM
ANALYZER
TYPE
2031
September 1
978
This
apparatus has been designed and tested according to class
II
of
IEC
publication
348,
Safety Requirements
for
Electronic
Measuring
Apparatus, and has been supplied
in
safe condition. The present
instruction
manual
contains
information
and
warnings
which
should
be
followed
by the user
to
ensure safe operation and to retain
the
apparatus in
safe condition.
CONTENTS
1.
INTRODUCTION
AND
SPECIFICATIONS
(PRODUCT
DATA)
.................................................
1
2.
CONTROLS
..........................................................................................................................
13
2.1.
FRONT PANEL
OF
NARROW
OF
NARROW BAND SPECTRUM ANALYZER
TYPE
2031
.............................................................................................
13
Controls used
for
Analog Input and General Operation
..
.. ..
..
.. .. ..
..
.. ..
..
..
..
.. .. ..
13
Controls used to set the Triggering Conditions
..
.
........
..
....
.
.. .. .. ..
..
.. .. .. ..
...
....
. 15
Controls used in Recording and Transformation of Data
...............................
16
Controls used in Averaging
of
Data ...
.... .. ....
..
.
..
..
....
....
..
.
..
.. .. .. ..
..
..
...
..
..
....
.
..
17
Controls used in
the
Display
of
Data ..
.... .. ....
..
.
..
..
.... ..
.
.. .. .. .. .. .. .... ..
..
.. .. .. .. ....
18
Controls used in•.
the
Input/Output
of
Data ..
.... ..
.
..
.. .. .. .. .... .. ..
.
.... .... .... .. .... ..
.
20
2.2.
THE
2031
DISPLAY
SCREEN
....................................................................
21
The
2031
Display Screen in Display of a Time Function .
.... .. .... ..
..
........
..
....
.
21
The
2031
Display Screen in Display of a Spectrum
..
.
.. ..
..
.. ..
...
........ .... ..
..
....
.
22
2.3.
REAR
PANEL
OF
THE
NARROW BAND SPECTRUM ANALYZER
TYPE
2031
.............................................................................................
23
3.
OPERATION
.........................................................................................................................
27
3.1.
PRELIMINARY ADJUSTMENTS
.................................................................
27
3.2.
CALIBRATION
.........................................................................................
28
Calibration using a Sinusoidal Reference
...................................................
29
Calibration using an External Noise Source
..
..
....
.. ..
..
..
..
.. .. .. .. ..
.
......
..
..
.
.. .. .. ..
30
3.3.
GENERAL OPERATIONAL PROCEDURE
......................................................
31
3.4
. CONTROL OF TRIGGERING
......................................................................
31
Selection of Triggering Source
..
....
..
.
....
.
..
.. ..
.
..
....
..
.
..
.. .. .. .. .. .. .... .. .. .. .. .... .. .. ..
31
Use of the "Records after
Trig."
Control
.... .. ............ .. ....
..
.... ..
.
..
.. ..
..
.. .. .. .... ..
32
3.5.
CONTROL
OF
RECORDING
.................
..
....................................................
33
3.6.
CONTROL
OF
AVERAGING
.......................................................................
34
Linear Averaging .....................................................................................
34
Exponential Averaging .
..
.. .. .. .. .. ..
....
.
..
.
....
.. ..
....
..
....
.. ..
..
.. .. ..
...
..
..
....
.
.. .. .. ..
..
..
36
Hold. max. ..............................................................................................
36
3.7.
USE
OF
THE
DISPLAY CONTROLS
.. .. .... ....
.. ..
..
.. ..
....
.
..
.
..
.. ..
.
..
..
....
.
.. ..
..
.. ..
..
..
36
Display
of
a Time Function ......
.... .. ..
..
.... .. ..
......
....
.
.. ..
..
.. .. .. ..
..
.. ..
...
..
...........
37
Display of a Spectrum
..
.. .. .. .. .. ..
....
..
.... .. ..
.. ..
.... .... ....
.. ..
....
.. .. ..
..
.. .. .. ..
..
.. ..
..
..
39
Use of a Reference
Memory
..
.... .. ......
.
....
.. ..
.
........ ..
.
..
.
..
..
....
.
..
.. ..
...
........
.
..
..
39
Display
of
Difference Spectra ....................................................................
40
3.8.
ANALYSIS
OF
TRANSIENTS
.....................................................................
40
Analysis of Single Transients
..
..
.
.... .. ..
.
.... .. ..
.
........ .... .. ....
..
....
.
..
..
.
......
....
..
.
..
42
Automatic
Transient Averaging
..
.....
.... .. ..
.. ..
....
..
.... ..
..
.
..
..
.... ..
.
..
.. .. .. ..
..
.. .. ..
..
43
Manual Averaging of Transients
with
Rejection
of
Bad Data ..
..
.
..
.. .. .. ..
..
.. ..
....
43
3.9.
ANALOG OUTPUT FROM THE
2031
..........................................................
43
Analog
Output
to a Level Recorder Type
2307
............................................
44
Analog
Output
to an
X-Y
Recorder Type
2308
..........................................
46
Exchange
of
the
Level Recorder and
X-Y
Recorder interfaces
......................
48
3.1
0.
USE
OF
AN EXTERNAL SAMPLING FREQUENCY
........................................
49
Use
of
the
Tracking Frequency
Multiplier
Type
1901
with
the
2031
.....
..
..
....
50
3.11.
RACK MOUNTING
OF
THE
2031
.................. .. ........................
..
....
..
..
.. ..
....
50
4.
DIGITAL
DATA
TRANSFER
AND
REMOTE
CONTROL
OF THE
2031
VIA
THE
IEC
INTERFACE
.....................................................................................................
52
4.1 .
IEC
FUNCTIONS IMPLEMENTED
.................
.
...............................................
52
4.2.
SELECTION
OF
ADDRESSES
.....................................................................
52
4.3.
CODES
FOR
ADDRESSING
2031
CONTROLS
..............................................
53
F.S. FREQUENCY
.....................................................................................
54
TRIGGER "Records a.
Trig."
.............................................
..
.......
................
54
AVERAGING
"No.
of
Spectra"
.
..................................................................
55
TRIGGER
''Level''
.............
..............................................
..
........................
55
INPUT
''Att
0-100
dB''
............................................................................
55
TIME FUNCTION
"Move"
...........................................................................
56
SPECTRUM GAIN
.....................................................................................
56
LINE SELECTOR
.......................................................................................
57
Other
Controls, Upper Front Panel
of
2031
.............................
.
...................
57
Other
Controls,
Lower
Front Panel
of
2031
.......................
..........................
58
Differences Between Remote and
Manual
Control
of
the
2031
..........
....
........
59
4.4.
REQUIRED FORMATS
FOR
DIGITAL INPUT
AND OUTPUT OVER
THE
2031
IEC
INTERFACE
...........................................
60
Mode#
0,
Digital
Input/Output
of
an ASCII Encoded Spectrum
......................
60
Mode#
1, Remote Setting
of
Pushkeys and
Output
of
Pushkey Settings
..........
61
Mode#
2, Digital
Input/Output
of
Time Function
..........................................
62
Mode#3.
Block Transfers MSBY-LSBY
to
and
from
the
2031
.......................
62
Mode#4.
ASCII Sensing
of
Pushkeys
.........................................................
63
Mode#
5, Digital
Output
of
2's
Complement Encoded
Spectrum
....................
64
Mode#
6, Block Transfers LSBY to and
from
the
2031
.................................
64
Mode#
7, Block Transfers MSBY
to
and
from
the
2031
................................
64
Mode#8,
Carry On Processing
......................................
.
...........................
64
Other
Input/Output
Modes,
Manual
Digital
Input/Output
.............................
65
Other
Input/Output
Modes,
Input
of
Alphanumeric
Text to
the
Display Screen
65
4.5.
USE
OF
INTERRUPTS
IN
2031
DATA TRANSFERS
.......................................
66
Read-out of
the
Time Function
with
Interrupt
Control
...................................
66
Read-out of
the
Complex Spectrum
with
Interrupt
Control
.............................
67
Read-out of
the
Averaged
or
Instantaneous
Spectrum
with
Interrupt
Control
.................................................................
67
4.6.
FORMATS USED
IN
BLOCK TRANSFERS
....................................................
68
Format
of
the
16-bit
Time Function
.........................................
.........
..........
68
Format
of
Complex Spectrum
.....................................................................
68
Format
of
Instantaneous Power Spectrum
...................................................
68
Format
of
Averaged
MS
Spectrum
..............................................................
69
Format
of
Spectrum Display
Buffer
.............................................................
69
Format of Reference
Memory
.....................................................................
70
Format of the
8-bit
Time Function
..............................................................
70
4.7.
SPEED
OF
DIGITAL INPUT AND OUTPUT
....................................................
71
FEATURES:
•
High
resolution,
constant
bandwidth
frequency
analysis
in
400
frequency
channels
• Eleven selectable
frequency
ranges
from
0-
10
Hz
through
0-20
kHz
• Full
transient
recording
facilit
ies
with
internal,
external,
or
free
running
trigger
and
control
of
after
trigger
recording
•
Display
of
time
signal,
instantaneous
spectrum,
averaged
spectrum,
and
spectrum
difference
on
11"
display
screen
•
Greater
than
70
dB
dynamic
range
plus
9 dB
crest
factor
capabiI
ity
•
Built-in
antialiasing
filters
• Exponential and
linear
averaging
over
1
to
2048
spectra
• Hold max.
facility
allows
maximum
level in each
channel
to
be held
• Selectable
flat
(rectangular)
or
Hanning
weighting
•
Display
of
spectrum
over
80
dB,
40
dB,
or
20
dB
display
range
•
Memory
allows
storage
of
spectrum
for
comparison
with
later
data
• First
estimate
transfer
function
measurements
18-200
type
2031
Narrow
Band Spectrum Analyzer
possible
using
memory
subtract
feature
•
Alphanumeric
read-outs
directly
from
display
screen
using
line
selector
• Read-outs
using
line
selector
can be made
relative
to
values
in
other
channels
or
lines
•
Output
of
displayed data
via analog
output
•
Digital
input
and
output
via
IEC
interface
•
Settings
of
major
controls
shown
on
display
screen
via
alphanumeric
displays
• Pushkey
controls
externally
programmable
via
IEC
interface
,..,_
• ...,f;ti'K'tOW<OANI\>a
..
l'"aol'
r
:;-:::
1 1
;~,
--
L-
y~oo,.,_,._
_.:J
' '
.:
.:
..
:
.:
.
kll'l
...
_
........,.,
•
Connection
to
IEC
or
IEEE
Std.
488
interface
bus
via
IEC
interface
USES:
•
Analysis
of
acoustical and
vibrational
signals
•
Analysis
of
transients
and
shocks
• Preventive
maintenance
and
machine
monitoring
• Speech
analysis
and
phonetics
•
Order
analysis
• Physiological and
Neurological
research
Introduction
The
Narrow
Band
Spectrum
Anal-
yzer Type
2031
is an
instrument
de-
signed
for
the
narrow
band
fre-
quency
analysis
of
continuous
and
transient
data
coming
from
acousti-
cal,
vibrational,
and
other
signal
sources.
It
calculates
a
400
channel
constant
bandwidth
RMS
power
spectrum,
in
dB,
of
the
input
signal.
The
frequency
range
of
the
instru-
ment
is
pushkey
selectable
in
a
1-2-
5 sequence
from
0-10
Hz
to
0-
20
kHz.
Alternatively,
by
using
an
external
sampling
source,
the
fre-
quency
range can be made
to
float,
allowing
the
2031
to
track
pheno-
mena
of variable
frequency,
as in,
e.g.
order
analysis
. The
time
taken
to
generate
a
single
spectrum
is
less
than
200
ms,
giving
real-time
operation
up
to
greater
than
2kHz.
The
2031
operates by
Fourier
transforming
records
of
1
024
sam-
ples
of
the
input
signal
into
the
fre-
quency
domain.
The
recording takes
place
in
a
transient
recorder
having
two
parallel
memories
.
The
trigger-
ing
facilities
available on
the
recor-
der
enable
the
2031
to
be used in
the
analysis
of
a
wide
range
of
sig-
nals.
The
transient
recorder's
free
run-
ning
mode
is used
to
analyze
contin-
uous
signals. Here,
new
records are
continuously
taken and
trans-
formed
.
Where
the
signals
to
be an-
alyzed are
intermittent
or
transient,
the
triggered
mode is used. Here,
transformation
only
takes place on
receipt
of
a
trigger,
the
source
of
which
may
be
internal,
with
a
trig-
ger
level variable in
200
steps ac-
ross
the
input
voltage range,
or
ex-
ternal
from
a TTL pulse.
In
the
triggered
mode,
the
after
trigger
recording
setting
selects pre-
cisely
which
record is
transformed
with
respect
to
the
trigger.
Its
wide
range
of
adjustment,
namely
0,0
to
9,9
record
lengths
in steps
of
0,1
record
lengths,
enables
transient
data
to
be analyzed even
when
they
are
quite
remote
from
the
precise
moment
of
triggering.
Further,
in
the
analysis
of
cyclic processes,
it
allows
part
of
the
signal
to
be gated
and analyzed
independently
from
the
rest, e.g.
the
opening or closing
of
a valve in a
machine
cycle.
2
The
2031
can be set
such
that
each
new
record taken is
trans-
formed.
Alternatively,
in
the
analy-
sis
of
single
transients,
recording
and
transformation
may
be stopped
as soon as
the
first
record has been
transformed
.
Transformed
data can be
exponen-
tially
or
linearly
averaged over 1
to
2048
spectra. Exponential averag-
ing is
useful
in looking at
running
processes,
where
changes
are
im-
portant,
while
linear
averaging be-
comes preferable
where
it
is
import-
ant
that
all data being
input
has an
equal
influence
on
the
final
average
generated, e.g.
in
spatial averaging
or
averaging
of
cyclic processes.
Note
that
linear
averaging is con-
trolled
such
that
a
true
average is al-
ways
displayed,
this
converging
on
the
final
result.
A hold max. mode
is also available,
allowing
the
maxi-
mum
value
occurring
in
each
chan-
nel
to
be held.
Exponential and
linear
averaging
and
the
hold
max
. mode are
equally
applicable
to
the
analysis
of
continu-
ous
and
transient
data. This
means
that,
e.g.
in
the
previous
example,
the
signal
generated
by
the
opening
or
closing
of
the
valve could be aver-
aged over
many
cycles.
Display
of
the
analyzed
spectrum
takes place on an
11"
calibrated
dis-
play screen,
which
may
also be
used
to
show
the
time
function.
Both
the
instantaneous
and
the
av-
eraged
spectrum
can be
shown
,
and
either
can be
entered
into
a ref-
erence
spectrum
memory
and re-
called later
for
comparison
with
new
,
incoming
data. A
further
dis-
play mode gives
the
difference
be-
tween
new,
incoming
data and
the
stored data.
This
allows
changes
in
spectra
to
be
identified,
and
where
sufficient
stationarity
exists,
allows
the
magnitude
of
a
transfer
function
to
be measured.
Read-outs
from
the
display
can be
plotted
using
a Level Recorder Type
2307
or, (optional), an
X-Y
Recor-
der
Type
2308
via
the
analog
out-
put,
or
digitally
transferred
to
an
IEC
compatible
peripheral
via
the
IEC
interface.
This
interface
also
permits
the
digital
read-in
and read-
out
of
data, and
the
reading and
the
setting
of
the
front
panel
controls,
as used
in
the
remote
programming
of
the
2031.
The
frequency
and RMS
ampli-
tude
of
any
channel
in
the
spec-
trum,
or
the
relative
position
of
any
sample
in
the
time
function
can be
read
from
alphanumeric
displays on
the
display
screen, by
using
the
line
selector. (Note
that
when
external
sampling
is used, spectral read-outs
are
in
terms
of
amplitude
and
chan-
nel
number.)
Further
alphanumeric
displays give
the
settings
of
the
ma-
jor
controls
such as
the
full
scale le-
vel,
full
scale
frequency,
etc.
Amplitudes
are read
from
the
2031
in
terms
of
dB. The reference
level is
usually
set
to
1
JJV
RMS,
but
may
be varied
throughout
a
range
of
±
50
dB
from
that
level.
Alt-
ernatively,
the
RMS level
in
any
channel
of
a displayed
spectrum
can be
set
to
0 dB, and all
the
fol-
lowing
amplitude
measurements
made
relative
to
that
level. Like-
wise,
the
position
of
a
sample
in
the
time
function
can be read
in
ab-
solute
terms,
or
relative
to
the
posi-
tion
of
any
other
sample, as a
sam-
ple
number
and as a
time
in
sec-
onds.
The
amplitude
display
range
of
the
2031
can be set
to
80
dB,
40dB,
or
20dB
. The
full
scale level
can be varied over
80
dB
in
10
dB
steps. Hence,
this
allows
a
40
dB
or
a
20
dB
amplitude
window
from
the
displayed
spectrum
to
be expanded
to
fill
the
entire
display
screen.
Simi-
larly,
when
a
time
function
is
dis-
played,
the
time
axis can be ex-
panded by a
factor
of
3.
Input
to
the
2031
is via a
stand-
ard B & K
measuring
amplifier
in-
put,
allowing
connection
of
most
B & K
microphone
preamplifiers
and
other
signal
sources.
An
internal
amplitude
reference
is provided
to
ease
calibration
. Frequency calibra-
tion
is made
unnecessary,
since
all
measurements
are referenced
to
an
internal
crystal
controlled
oscillator
.
Prior
to
recording and
transforma-
tion,
the
input
signal
is passed
through
an
antialiasing
filter,
auto-
matically
selected
with
the
fre-
quency
range.
This
filter,
which
cuts
off
at
the
selected
full
scale
fre-
quency,
is
to
prevent
the
introduc-
tion
of
aliasing
distortion,
and
may
be bypassed
if
required. For
exter-
nal
sampling,
either
the
internal
or
external
antialiasing
filters
may
be
used.
Before
transformation,
the
time
records
may
be
weighted
using
a
Hanning
weighting.
This
is
usually
used
in
the
analysis
of
continuous
signals
to
improve
selectivity.
For
the
analysis
of
transients,
however,
where
the
Hanning
weighting
might
modify
the
data
under
analysis,
a
flat
weighting,
(i.e.
rectangular
or
no
weighting),
may
be
selected
.
Frequency Analysis
The
mathematical
basis
for
all
fre-
quency
analysis
procedures
is
the
so-called
Fourier
Transform.
In its
most
genera
I
form,
it
is
expressed
by
the
Fourier
integral
pair
as
fol-
lows:
1 1
00
F(w)
= -
f(t)
exp
(-jwt)
dt
21T
-oo
(1)
f(t)
=
~-~
F(w)
exp
(jwt)
dw
(2)
Equation
1
transforms
the
time
function
f(t)
into
its
complex
fre-
quency
components
F(w)
for
each
(angular)
frequency
w
radians
/s,
(w = 21rf,
where
f
is
the
frequency
in
Hz).
Equation
2
shows
how
the
original
time
signal
f(t)
can
be
com-
pletely
synthesized
from
its
original
frequency
components.
It
is
possible
to
write
discrete
equivalents
of
equations
1
and
2 as
follows:
1
N-
1 ( 21rnk)
F(k) = - L
f(n)
exp
-j
--
N n=O N
(3)
f(n)
=
N-1
I
k=O ( 21rnk)
F(k) exp j
-N-
(4)
These
two
equations
are
known
as
the
Discrete
Fourier
Transform,
or
DFT,
and
each
of
the
continuous
functions
F(w)
and
f(t),
extending
from
+
oo
to
-oo,
is
replaced
by
a
fi-
nite
number,
N,
of
discrete
sam-
ples,
these
being
F(k)
and
f(n)
respec-
tively.
If
Af
is
the
frequency
incre-
'
ment
between
the
samples,
and
At
is
the
time
increment,
then
kAf
is
the
frequency
corresponding
to
F(k),
750177
Fig.1.
Discrete
Fourier
Transform
of
Complex
Time
Function,
(real
part
only).
Note
the
periodic-
ity
of
the
spectrum
Real
Imaginary
761025
Fig.2.
Discrete
Fourier
Transform
of
Real-valued
Time
Function.
Note
the
symmetry
of
the
real
part
and
the
antisymmetry
of
the
imaginary
part
and
nAt
is
the
time
corresponding
to
f(n).
The
infinite
integrals
are
hence
replaced
by
finite
sums,
but
many
of
the
properties
of
the
DFT
are
parallel
to
those
of
the
integral
transform.
Equation
3
is
known
as
the
forward
transform,
and
equa-
tion
4 as
the
inverse
transform.
Although
it
is
of
a
discrete
na-
ture,
and
hence
lends
itself
to
digi-
tal
computation,
direct
evaluation
of
the
DFT
is
a
lengthy
and
inefficient
procedure
requiring
some
N2
com-
plex
multiplications
to
perform
an
N
point
transform.
Fast
Fourier
Trans-
form,
or
FFT, is
an
algorithm
which
allows
a
more
efficient
means
of
evaluation,
reducing
the
number
of
multiplications
required
to
approxi-
mately
N log2 N.
In
the
generalized
forward
trans-
form,
N
complex
time
domain
points
are
transformed
into
N
complex
fre-
quency
domain
points,
where
N is
usually
chosen
to
be a
power
of
2.
The
N
complex
frequency
domain
points
are
evenly
distributed
from
DC
to
the
sampling
frequency.
Fur-
ther,
the
spectrum
becomes
peri-
odic,
with
a
period
equal
to
the
sam-
pling
frequency,
i.e.
the
N
complex
points
are
repeated
up
and
down
the
frequency
axis
with
a
period
equal
to
the
sampling
frequency.
Taking
this
periodicity
into
~
account,
and
referring
to
Fig.1,
it
is
evident
that
those
points
falling
between
the
Nyquist
frequency,
(i.e
.
half
the
sampling
frequency),
and
the
sam-
pling
frequency
represent
the
nega-
tive
frequency
components
of
the
spectrum,
while
those
points
from
DC
up
to
the
Nyquist
frequency
re-
present
the
positive
frequency
com-
ponents.
A
simplification
leading
to
an
in-
crease
in
efficiency
occurs
whe
·n
it
is
assumed
that
the
time
domain
points
can
only
be real
valued,
(as
is
usually
the
case).
The
spectrum
will
then
be
conjugate
even,
mean-
ing
that
the
positive
frequency
com-
ponents
can
be
generated
from
the
negative
ones,
and
vice
versa,
i.e.
only
the
positive
or
the
negative
components
are
needed
to
define
the
whole
spectrum.
Using
this,
it
enables
N
real-valued
time
doniain
points
to
be
transformed
as
N/2
complex
points,
a
manipulation
be-
ing
made
on
the
results
to
obtain
the
spectrum
of
the
original
time
function
from
DC
to
the
Nyquist
fre-
quency.
Each
of
the
points
generated
by
the
above
process
wi
II
have
the
form
F(i) = ai +
jbi.
For
each
positive
component
F(i),
there
must
be
a
ne-
gative
frequency
component
F(-i)
=
3
ai-
jbi.
The
power
at
this
fre-
quency
is
the
sum
of
the
powers
of
the
positive
and
negative
frequency
components,
i.e.
2(ai2
+
bi2).
This
value
may
then
be
averaged
over
multiple
spectra
to
form
the
MS
value,
and
the
square
root
taken
to
form
the
RMS
value.
Description
A
simplified
block
diagram
of
the
2031
is
given
in
Fig
.3
.
It
can
be
split
into
four
sections,
the
Analog
Input,
the
Processor
,
the
Display
and
Analog
Output,
and
the
IEC
In-
terface
.
Its
architecture
is based
on
two
16
bit
buses,
the
Y-bus
and
the
D-bus,
over
which
all
data
flow
be-
tween
the
various
sections
takes
place
.
Analog
Input
Section
A
block
diagram
of
the
Analog
In-
put
Section
of
the
2031
is
shown
in
Fig.4.
The
Input
Amplifier
has
two
inputs.
One,
the
Preamplifier
In-
put,
is
the
standard
B & K
7-pin
type,
allowing
the
connection
of
most
B & K
Microphone
Preamplifi-
ers,
to
which
it
also
supplies
power
and
microphone
polarization
volt-
ages.
The
input
of
signals
from
other
sources
is
made
via
the
Direct
Input
.
Both
inputs
have
separate
sensitivity
adjustments,
such
that
differing
transducer
sensitivities
can
be
accommodated
.
Calibration
of
the
Input
Amplifier
and
the
rest
of
the
2031
can
be
checked
using
an
internal
Refer-
ence
Oscillator,
whose
frequency
is
controlled
such
that
the
calibration
signal
appears
in
channel
256
of
the
resulting
analysis.
Its
amplitude
is
100
dB
referred
to
1
J1V
RMS.
(Alternatively,
an
external
calibra-
tion
signal
can
be used.)
The
1
11V
RMS
reference
level
can
be
altered
by±
50
dB
in
steps
of
10
dB.
The
Input
Attenuation
setting
gov-
erns
the
level
setting
for
the
rest
of
the
analyzer
.
It
can
be
used
to
re-
duce
the
input
signal
level
in
steps
of
10
dB
over
a 1
00
dB
range,
us-
ing
the
front
panel
controls.
When
set
to
0
dB,
full
scale
deflection
corresponds
to
1
mV,
and
since
the
4
Front
Panel
Controls
Analog
Output
To
Level Recorder
Digital
Input
and
Output
Remote Programming
Information
over I
EC
Bus
770258
Fig.3.
Simplified
Block
Diagram
of
the
2031
Y-Bus
l[
Mode Set Register Master
Oscillator
1 l
·~
Reference
Oscillator Sample Rate Divider
Sa
~
Ext
.
mpling
,~,
L l
~
~
~
!
D
I
nput
o---
eamp.o---
Pr
I
nput
Input
f---
Amplifier
Input
Anti-
Attenu-
I--
aliasing
ation Filter
Sample
lnt
I--
and
I--
ADC
....__
errupt
Hold
Jl
D-Bus
770264
Fig.4.
Analog
Input
Section
of
the
2031
lowest
measurable
voltage
is
1
J1V,
this
gives
a
total
operating
range
of
1
60
dB.
Any
input
over-
load is
indicated
by
an
overload
indi-
cator,
and
an
upper
10
dB
indicator
shows
when
the
input
signal
is
within
10
dB
of
full
scale.
From
the
Input
Attenuation,
the
signal
enters
the
Antialiasing
Filter
.
This
is a
7-pole
elliptical
low
pass
filter
having
a
roll-off
of
113
dB/octave,
automatically
se-
lected
with
the
frequency
range
so
that
it
cuts
off
at
the
fu
II
seale
fre-
quency.
Its
purpose
is
to
avoid
alia-
sing
errors
when
the
input
signal
is
later
sampled,
and
it
may
be
by-
passed,
if
required
.
The
Antialiasing
Filters
may
also
be
used
when
sam-
pling
is
externally
controlled.
In
this
case,
the
cut-off
frequency
of
the
connected
filter
will
correspond
to
the
frequency
range
setting
.
The
low
pass
filtered
signal
now
enters
the
Sample
and
Hold
net-
work
and
Analog
to
Digital
Conver-
ter,
(ADC),
where
it
is
sampled
at
a
frequency
2,
56
times
the
full
scale
frequency,
the
sampling
frequency
being
derived
from
a
crystal
con-
trolled
Master
Oscillator.
Alterna-
tively,
an
external
sampling
fre-
quency
can
be
used,
whereupon
the
full
scale
frequency
becomes
the
sampling
frequency
divided
by
2,56
. Each
sample
taken
is
entered
into
the
ADC,
where
it
is
converted
into
a 1
2-bit
two's
complement
word.
Processor
Section
The
block
diagram
of
the
Proces-
sor
section
of
the
2031
is
given
in
Fig.5.
The
functions
of
the
Proces-
sor
are
to
control
the
input
of
data,
to
Fourier
transform
the
data,
to
av-
erage
the
spectra
produced
,
to
con-
trol
the
display
of
data,
and
to
sense
the
front
panel
controls
.
All
calculations
are
carried
out
in
the
Arithmetic
Logic
Unit,
(ALU),
un-
der
control
of
the
program
in
the
Program
Memory
. The ALU uses
floating
point
arithmetic,
and is pro-
vided
with
16
accumulator
registers
and
extension
registers
. The
pro-
gram
flow
is
controlled
by
the
Pro-
gram
Counter
and a 16 level Stack
is used
for
nesting
subroutines.
The
Constant
Register is used
to
enable
constants,
held
as
part
of
the
pro-
gram,
to
be
transferred
into
the
ALU
in
a
single
instruction
cycle.
The
instructions
contained
in
the
program
are decoded in
the
Instruc-
tion
Decoder.
Since
the
front
panel
control
settings
will
influence
which
subroutines
are
used,
it
also
de-
codes
these
. The decoded
instruc-
tions
and
control
settings
are
con-
verted
into
control
signals
in
the
In-
struction
Register. These
signals
control
all
functions
in
the
Proces-
sor.
The
Main
Memory,
where
all data
is
stored,
has a capacity
of
4K
16
bit
words.
Data is
entered
via
the
Memory
Data
register
into
which-
ever
address
has
been placed in
the
Memory
Address
register
. The
Bit
Reversal
allows
memory
addresses
to
be read
to
the
processing
sec-
tion,
(i.e.
the
ALU,
etc.), in
bit
re-
versed
order,
giving
an
increase
in
efficiency
when
reordering
the
fre-
quency
components
after
Fourier
Main
Memory
Fig
.5.
Processor
Section
of
the
2031
Transformation.
A
further
increase
in
efficiency
is
obtained
by use
of
the
sine
table,
which
may
also be
used
to
generate
the
Hanning
weighting
of
the
time
function.
The
Fourier
Transformation
pro-
cess uses
floating
point
arithmetic
on a block basis, i.e.
the
same
expo-
nent
is used
for
the
entire
block.
The
Maximum
Magnitude
Detector
is used to
optimize
the
exponent.
The
power
calculation
and averag-
ing
routines
use
true
floating
point
.
Conversion
of
the
analyzed spec-
trum
from
linear
to
logarithmic
form
is aided by
the
Log Table and
the
Shift
Counter
. The
Shift
Counter
is
also
used
in
floating
point
calcula-
tions
.
Output
and Display Section
The block
diagram
of
the
Output
and
Display
section
of
the
2031
is
shown
in Fig.6. The
displayed
data
is held in
the
Display
Memory.
De-
pending
on
the
settings
of
the
front
panel
controls
of
the
2031,
either
the
Input
Function,
(i.e.
the
time
function
,
the
instantaneous
spec-
trum,
or
the
averaged
spectrum),
the
Stored
Function,
(i
.e.
the
contents
of
the
reference
spectrum
memory,
which
might
be an
instantaneous
or
an averaged
spectrum),
or
the
differ-
ence
between
them
will
be passed
to
the
Display
Memory
by
the
Pro-
Level
Recorder
Output
Display
X-Y
Recorder
Output
(Option)
Y-Bus
D-B
us
770265
770259
Fig.6
.
Output
and
Display
Section
of
the
2031
cessor
under
program
control.
Alt-
ernatively,
the
Input
Function
and
the
Stored
Function
can be
alter-
nately
displayed.
All
updating
of
the
Display
Memory
takes place
during
the
X-flyback
of
the
display
screen,
under
interrupt
control
.
The
display
screen is a
400
line
display,
each
frame
lasting
approxi-
mately
20
ms
. Fig .7
shows
how
it
may
be used
to
display
a
time
func-
tion
. Here,
the
first
8
lines
are used
to
display
the
trigger
level set. The
next
two
lines
are
left
blank,
and
5
Indication
of
major
control
settings
Read-out
of
the
Line
Selector
Indication
of
the
selected
line
or
channel
Indicators
of
input
overload
or
upper
1
OdB
For
entry
of
a
signal
from
co-axial
sources
For
input
of
signals
from
most
8 & K
Microphone
Preamplifiers
Allows
adjustment
of
the
reference
level
in
steps
of
10 dB
Gives
continuous
adjustment
of
the
input
gain
6
Select
whether
the
signal
analyzed
comes
from
the
Preamplifier
or
Di-
rect
Input
.
Also
select
the
internal
calibration
signal
Control
trigger
mode
Set
input
attenuation
in
steps
of
1
OdB
Ret.,_,ce
Adju1t.
d8
0
-
10
•
•10
•
I I I
--
....._
___
Select
full
scale
frequency
Select
after
trigger
recording
setting
from
0,0
to
9,9
record
lengths
Select
external
sampling
and
allow
the
internal
antialiasing
filters
to
be
bypassed
---••
Control
trigger
level
N•rrow
8•nd
Spectrum An•lvze'
Type2031
Select
time
weighting
function
Select
number
of
spectra
to
be aver-
aged
Select
digital
input
or
output
Control
the
analog
output
Control
which
data is
displayed
on
the
display
screen,
and
which
data
is
output
Control
the
entry
of
data
into
the
memory
Control
the
entry
of
data
to
the
dis-
play
For
setting
a
reference
on
the
dis-
play
screen
Select
the
displayed
amplitude
range
of
the
displayed
spectrum
Select
a
line
or
channel
Expand and
move
a displayed
time
function,
and
move
a displayed spec-
trum
up and
down
the
screen
For
control
of
the
appearance
of
the
display
Resets
the
2031
to
a
preset
combi-
nation
of
control
settings
For
control
of
recording
For
control
of
averaging
•
Select
the
averaging
mode
7
Fig.7 .
Display
of
a
Time
Function
on
the
2031,
(expanded
mode)
then
341
of
the
remaining
390
lines
are used
to
display
every
third
sample
of
the
time
function,
(since
the
display
has
400
lines,
and
the
time
function
contains
1
024
sam-
ples,
it
is
not
possible
to
display
all
of
the
samples
simultaneously)
.
Alt-
ernatively,
in expanded mode, any
390
consecutive
samples
of
the
time
function
can be displayed.
The
390
samples
displayed can be
moved
within
the
time
function.
Display
of
a
400
channel
spec-
trum
can take place
over
an
80
dB,
a
40
dB,
or
a
20
dB
display
range.
The top
line
of
the
display
can be
made
to
represent
from
+ 10 dB
to
-70
dB
with
respect
to
the
full
scale
input
level,
in
steps
of
1
OdB.
This
enables
either
the
whole
spec-
trum
to
be
shown,
or
a
20
dB
or
40
dB
window
from
it
to
be ex-
panded
to
fill
the
entire
display
screen.
Display
of
the
difference
be-
tween
the
Input
Function
and
the
Stored
Function
is
in
terms
of
posi-
tive
and
negative dB values
dis-
placed
about
a 0 dB
line.
Again,
an
80
dB,
40
dB,
or
20
dB
amplitude
range
may
be selected,
with
a
dis-
play
gain
of±
40
dB
in
10
dB steps.
Simultaneously
with
the
display
of
a
time
function,
spectrum,
or
spectrum
difference,
the
Character
Generator
gene~ates
alphanumeric
displays on
the
display
screen
to
show
the
settings
of
the
full
scale
8
input
level,
the
full
scale
frequency,
the
number
of
records
of
after
trig-
ger
recording,
and
the
number
of
spectra
to
be averaged, (and
when
a
linear
average is in progress,
the
number
of
spectra already aver-
aged), along
with
an
indication
of
whether
an overload has
occurred
during
the
generation
of
the
dis-
played data. They also give
the
read-
out
of
the
line
selected by
the
Line
Selector,
which
in
the
case
of
a
dis-
played
time
function
will
be
the
time
and sample
number
of
the
se-
lected sample in
the
time
function,
measured
either
in absolute
terms
or
relative
to
the
position
of
any
other
sample. In
the
case of a
dis-
played
spectrum
or
spectrum
differ-
ence,
the
read-out
will
be
the
chan-
nel
number,
the
frequency
in
hertz,
and
the
RMS level in dB
of
the
se-
lected
channel
. The dB
read-out
may
be referenced
either
to
the
ref-
erence level set in
the
Input
Ampli-
fier,
or
to
the
level in
any
channel
of
any
displayed
spectrum
or
spec-
trum
difference
. (Note
that
when
ex-
ternal
sampling
is selected,
the
fre-
quency
read-out
is suppressed.)
Any
displayed
information
may
be
output
to
a Level Recorder Type
2307
or
an
X-Y
Recorder Type
2308,
(X-Y
Recorder
output
via op-
tional
card ZN
0204
which
replaces
Level Recorder output).
Output
is al-
ways
of
the
displayed
information.
IEC
Interface
Digital
input
and
output,
and
the
transfer
of
remote
programming
in-
formation
takes place over
the
IEC
Interface
of
the
2031,
which
is
de-
signed according
to
the
IEC
propo-
sal,
"Standard
Interface
for
Pro-
grammable
Measuring
Apparatus,
Byte-Serial
Bit-Parallel"
TC
66.
The
interface
can be operated
with
or
without
a
controller.
When
operated
without
a con-
troller,
the
interface
allows
the
read-
in
and
read-out
of
any
spectrum,
(be
it
averaged,
instantaneous,
or
difference), and
the
read-in
and
read-out
of
the
front
panel
settings.
Read-ins and read-outs are in
AS-
CII.
When
the
interface
is operated
with
a
controller,
then
it
becomes
possible
to
read in
or
to
read
out
from
any
data block in
the
Main
Me-
mory.
This extends
the
read-in
and
read-out
facilities
outlined
above
to
include,
e.g.
read-out
of
the
time
function,
read-out
of
the
instantane-
ous
spectrum
with
a
linear
ampli-
tude
scale, access
to
the
alphanum-
eric
displays on
the
display
screen,
etc.
Further,
read-in and
read-out
may
be in ASCII
or
in
binary
form.
The
2031
is
completely
program-
mable
over
its
IEC
interface.
All
of
the
front
panel
pushkeys can be
remotely
sensed and
controlled.
Firmware
Routines
The
program
used
to
control
oper-
ation
of
the
2031
can be divided
into
three
parts,
namely,
the
Main
Program,
the
Analog
Input
Interrupt
Routine,
and
the
Output
to
Display
Interrupt
Routine
. The
Main
Pro-
gram
operates
continuously
with
new
samples
being
placed
in
the
Main
Memory,
and data
being
trans-
ferred
from
the
Main
Memory
to
the
Display
Memory
under
the
interrupt
control
of
the
two
other
routines
.
The
time
taken
for
the
Main
Pro-
gram,
which
controls
the
weighting,
transformation,
power
spectrum
cal-
culation,
and
the
averaging
rou-
tines,
is less
than
200
ms,
includ-
ing
the
time
lost
due
to
interrupts.
Since
operation
of
the
2031
is
buf-
fered,
i.e.
recording
and
transforma-
tion
take place
in
parallel,
this
gives
full
real-time
operation
in all
fre-
quency
ranges up
to
0-2
kHz.
The
averaging
routines
use
three
different
algorithms.
The
first
of
these,
used
in
linear
averaging,
is
as
follows:
-------,
1
~
n
~
N
n
where
Yn is
the
current
average,
Y
n-1
is
the
previous
average,
Xn
is
the
current
instantaneous
value,
and
N
is
the
number
of
spectra
to
be
averaged.
This
algorithm
will
al-
ways
cause
a
true
arithmetic
aver-
age
of
X1
to
Xn
to
be
displayed,
irre-
spective
of
the
value
of
n.
Yn
con-
verges
on
YN as n
approaches
N,
and
when
n = N,
the
average
stops
and
the
result
is
held.
The
averager
may
then
be
reset,
and
a
new
aver-
age
started.
Alternatively,
the
new
average
may
be
started
and
added
to
Y
Ni.
Since
the
averager
accumu-
lates
on
an
energy
basis,
this
al-
lows
a
number
of
averages
to
be
added,
the
RMS
amplitudes
of
the
fi-
nal
spectrum
formed
being
cor-
rected
for
the
number
of
additions.
The
exponential
averaging
algor-
ithm
is
identical
to
the
linear
averag-
ing
algorithm,
except
that
n is re-
placed
by
N/2,
i.e.,
y =
n
(N/2-
1)
Yn_
1 +
Xn
N/2
This
produces
an
exponentially
weighted
average,
i.e.,
the
most
re-
cent
data
has
the
greatest
influence
on
the
result,
and
older
data
is
grad-
ually
forgotten.
The
average
contin-
ues
for
n~
N/
2.
Note
that
both
ex-
ponential
and
linear
averages
can
have
pauses
introduced
while
they
are
in
progress,
allowing,
e.g.,
a
change
of
signal
source.
The
value
of
N is
selected
via
the
2031
front
panel
controls,
and
for
the
same
value
of
N,
exponential
and
linear
averaging
will
produce
re-
sults
having
similar
statistical
accu-
racies
but
not
necessarily
the
same
numerical
values.
In
exponential
av-
eraging,
the
first
spectrum
output
is
equal
to
the
first
instantaneous
spectrum
input,
whereafter,
averag-
ing
proceeds
according
to
the
algor-
ithm
given
above. In
the
case
of
de-
terministic
signals,
this
gives
a
fas-
ter
convergence.
Exponential
and
linear
averaging
for
the
same
data
points
are
com-
15
QJ
14
"0
.e
13
a.
E
12
<{
~
-o--
-o--0-<>---<>---
-o-
.()...-
-0
11
10
9
8
6
5
4
3
2
\\
X
\ \\\\ x
\
'><
'\.
><,
---+-
Instantaneous values
-X-
Exponential
Average
-~-Linear
Average
'><
......
X..-x:
1 2 3 4 5 6 7 8 9 10
11
12
13
14
15
16
17·
18
19
20
770267
/ 1
Fig.8
.
Comparison
of
Exponential
and
Linear
Averaging
Frequency
0,1
0,2 0,4 0,6 0,8 1
1
x-
T 2,0 4,0 6,0 8,0
0
~
r--
......
.........
~
.........
\ h
\
,.....,
\
If
\\
f\n
(\
1--T-i
I \ I ..-
II
I
Flat
cb
\ I \
l I \
Hanning
/t\
II
If\
II I/ I
II
,,
il
I I \
I I I I I
I,.._
I,\
CD
"0
10
20
30
40
50
60
770260
Fig.9.
Comparison
of
Flat
and
Hanning
Weighting
Functions
pared,
for
N=8,
in
Fig.
8.
At
n=8,
the
linear
average
stops,
while
the
exponential
average
continues
.
The
third
averaging
algorithm
gives
the
hold
max.
mode
of
the
2031.
Here,
the
maximum
level
oc-
curring
in
each
channel
is
held,
and
a
spectrum
is
developed
consisting
of
these
maxima.
The
Analog
Input
Interrupt
Rou-
tine
controls
the
input
of
data,
set-
ting
the
Trigger
conditions
and
the
After
Trigger
Recording
according
to
the
front
panel
controls.
The
After
Trigger
Recording
is
used
in
the
2031's
triggered
mode
to
allow
the
record
transformed
with
respect
to
the
trigger
to
be
varied
from
that
im-
mediately
before
the
trigger
to
that
ending
9,
9
record
lengths
after
the
trigger,
in
steps
of
0,
1
record
lengths
.
The
records
taken
by
the
2031
in
both
its
free
running
and
triggered
modes
can
be
transformed
with
a
flat
or
a
Hanning
weighting.
Where
the
resolution,
{3,
is
defined
as
be-
ing
one
fourhundredth
of
the
analy-
sis
range,
the
3 dB
bandwidth
using
flat
weighting
is
0,88
{3,
while
Han-
ning
gives
1
,44{3.
The
possibility
of
sidelobes,
however,
normally
means
that
flat
weighting
gives
the
worse
selectivity
of
the
two,
mean-
ing
that
Hanning
weighting
is
usu-
ally
used
with
continuous
signals.
In
the
analysis
of
transients,
though,
where
the
Hanning
weight-
ing
might
modify
the
captured
data,
use
of
a
flat
weighting
is
usually
preferred.
Flat
and
Hanning
weight-
9
worse
selectivity
of
the
two,
mean-
ing
that
Hanning
weighting
is
usu-
ally
used
with
continuous
signals.
In
the
analysis
of
transients,
though,
where
the
Hanning
weight-
ing
might
modify
the
captured
data,
use
of
a
flat
weighting
is
usually
preferred.
Flat
and
Hanning
weight-
ings
are
compared
in
the
frequency
domain
in
Fig.9.
Although
said
nominally
to
start
at
0 Hz,
the
centre
frequency
of
the
first
channel
of
the
analysis
is in
fact
f3
Hz. The
frequency
range
of
the
analysis
is
hence
f3
Hz
to
400
/3Hz.
Examples of
Use
Preventive
Maintenance
The
vibration
spectrum
of
a
me-
chanical
part
of
a
machine
has long
been recognized as a
means
of
pre-
dicting
the
impending
failure
of
that
part
. The
2031
provides
a
fast
and
efficient
method
of
obtaining
the
vi-
bration
spectrum.
The
Accelerome-
ter
Type
4366
is
attached
to
the
part
of
the
machine
under
investiga-
tion,
and
the
acceleration
signal
which
it
produces
is
entered
into
the
Charge
Amplifier
Type
2635
.
The
2635
gives a
conditioned
out-
put
in
terms
of
acceleration,
veloc-
ity,
or
displacement,
which
is
anal-
yzed
using
the
2031.
Whether
the
machine
may
continue
operation,
or
should
be
shut
down
for
repair
may
then
be decided by
comparing
the
Transmitting Room
Tape Recorder
7003
Accelerometer
4366
Charge
Amplifier
2635
~
~
• •
I I
Machine under investigation Narrow
Band
Spectrum Analyzer
2031
170508
Fig.1
0.
Use
of
2031
in
Preventive
Maintenance
/'
D~o
l
~
~
/pt
~
I
..
~
.<
?,
~
·
:~i=~=:
--
Tektronix
4051 Narrow
Band
Spectrum Analyzer Hewlett-Packard
HP
9825A
2031
770262
Fig.11
. Use
of
2031
with
a
Desk-top
Calculator
results
obtained
with
known
allow-
able
limits.
For
off-line
preventive
mainte-
nance,
a
short
example
of
the
vibra-
tion
signal
could
be recorded, e.g.
on a Tape Recorder Type
7003,
and
brought
back
to
the
laboratory
for
analysis
.
Where
the
2031
is
con-
nected
to
an
IEC
or IEEE
compatible
desk-top
calculator,
the
results
ob-
tained
could
be
compared
with
a
lib-
rary
of
reference
spectra
held
on
a
cassette.
Where
the
results
indicate
Receiving Room
that
further
measurements
are re-
quired,
the
2031,
with
or
without
the
calculator,
could
be
taken
to
the
measurement
site.
Connection
to
Desk-top
Calculators
Since
the
2031
is
equipped
with
an
IEC
interface,
it
can be
con-
nected
into
an
IEC
interface
bus
sys-
tem.
Further,
since
the
only
signifi-
cant
difference
between
this
inter-
face and
one
designed
according
to
the
IEEE
standard
488-1
975
is
the
Microphone Power Supply
2807
Microphone
4165 Microphone
4165 Microphone
Preamp!ifiers 2619
10
Power
Amplifier
2706 Noise Generator
1405
Fig.12.
Use
of
2031
for
measurement
of
Transmissibility
Narrow Band Spectrum Analyzer
2031
770261
Accelerometer
4368
~
~
Tracking
Frequency
Multiplier 1901
Narrow
Band
Spectrum
Analyzer
2031
77
0263
Fig.
13.
Use
of
2031
in
Order
Analysis
Of
part
i
cular
interest
here
is
the
connection
of
a
2031
to
an
IEC
or
IEEE
compatible
desk-top
calculator.
The
ca
leuI
at
or
may
then
be used
to
operate
on data
supplied
by
the
2031,
as
well
as
completely
rem-
otely
control
the
2031
in
automatic
test
sequences.
Data
may
also be re-
called
from
the
calculator
to
the
2031
for
display
and
comparison
with
new,
incoming
data.
Further,
Fig.14.
Rear Panel
Sockets
of
the
2031
Input
Characteristics:
Input:
Either
"Direct
Input
" or standard
B & K 7 pin
"Preamplifier
Input"
Input
Impedance:
Direct. 1
MO
/ I 1
00
pF
Maximum
Input
Voltage:
2031
is a
Safety Class
II
instrument
(IEC
348)
. For
safe operation in accordance
with
IEC
348,
the voltage
of
the signal
or
signal
ground relative
to
earth
must
not
exceed
the
2031
can
become
part
of
a
larger
test
system,
where
it
is
called
up
on
demand
over
its
IEC
in-
terface
to
carry
out
tests
and
meas-
urements.
Bruel
& Kjrer
suggests
the
Tek-
tronix
4051
and
the
Hewlett-Pack-
ard HP
9825A
for
use
with
the
2031
and
other
8 & K
instruments
equipped
with
an
IEC
interface
. Rec-
ommended
memory
size
for
the
4051
is
32
K.
Recommended
mini-
mum
memory
size
for
the
9825A
is
15
K
(Memory
option
001
).
The
9825A
should
also be
equipped
with
Hewlett-Packard
options
98034A,
9821
OA
and
9821
3A
.
Estimates
of
Transfer
Functions
and
Transmissibilities
The
spectrum
difference
mode
of
the
2031
can be used
to
measure
the
magnitude
of
a
transmissibility
or
transfer
function,
provided
that
there
is
sufficient
stationarity
in
the
process
under
investigation.
Fig.12
shows
how
this
might
be used
to
measure
the
transmissibility
of
a
wall
or
panel
. The
transmitting
room is excited
with
white
noise.
The
spectrum
in
the
transmitting
room is
obtained
using
the
micro-
Specifications
2031
42
V RMS (sine). To ensure safe opera-
tion
within
IEC
348
at
higher
voltages,
the
user
must
limit
all
input
currents
to
0,7
mA
peak.
Sensitivity:
11 full-scale sensitivity
ranges, (overload
limit
of
ADC), 10 dB
steps
from
66
dB
pV
to
1
66
dB
pV
RMS
(sine).
Input
Attenuator:
0 to 1
00
dB in
10
dB
phone
and
the
2031,
and
placed in
the
reference
memory.
The
2031
is
then
switched
to
the
microphone
in
the
receiving
room.
When
it
is
switched
to
its
difference
mode,
the
2031
will
show
the
difference
in
dB
between
the
spectrum
in
the
transmitting
room and
the
spectrum
in
the
receiving
room,
i.e.
after
cor-
rection
for
the
room
constants,
the
transmissibility
of
the
wall.
Order
Analysis
t=ig
.1
3
shows
how
the
2031
can
be used
for
order
analysis.
Here,
the
Tracking
Frequency
Multiplier
Type
1901
is used as an
external
sampling
source
for
the
2031.
The
1
901
inputs
a
signal
related
to
the
fundamental
frequency
of
the
mo-
tor,
such
as
the
pulses provided by
the
Magnetic
Transducer
MM
0002
. It
then
outputs
some
multi-
ple
of
this
frequency,
selected on
the
1901,
which
becomes an
exter-
nal
sampling
frequency
for
the
2031
. The
2031
analyzes
the
sig-
nal
coming
from
the
accelerometer
end
preamplifier
in a range
from
0 Hz
to
1/
2,56
of
the
frequency
supplied
by
the
1901.
In a
normal
analysis,
with
internal
sampling
con-
trol,
if
the
speed
of
the
motor
var-
ied,
the
positions
of
components
of
the
signal
under
analysis
related
to
the
motor
speed
would
change
on
the
2031
display
screen.
However,
use
of
the
1901
ensures
that
the
highest
frequency
analyzed is re-
lated
to
the
motor
speed. Hence,
if
the
motor
speed
changes,
the
analy-
sis range
changes
in
sympathy,
en-
suring
that
the
speed related
compo-
nents
stay
in
the
same
channels
on
the
screen
.
This
allows
the
relation-
ships
between
the
amplitudes
of
the
various
motor
speed related
components
, or
"orders",
and
the
motor
speed
itself
to
be
studied.
steps, accurate
to±
0,1 dB
Gain
Control:
0 to 10 dB
Sensitivity
Adjustment
(Direct)
:
+ 4,
7dB
to -
10dB
Sensitivity
Adjustment
(Preamp):
+ 4,
7dB
to -
10dB
Amplitude
Reference:
1
00
dB referred
to 1
pV
, frequency
64%
of selected full
scale frequency
11
Antialiasing
Filters:
11
filters
automati
-
cally selected
with
frequency
range.
Max
±0 ,2 dB ripple in
the
passband,
113
dB/octave roll
off
. Provide at least
70
dB
attenuation
of
any
components
in
the
input
signal having frequencies
higher
than
1,
56
times
the
full
scale
fre-
quency. The
filters
can be bypassed,
if
re-
quired
Sampling:
2,56
x
full
scale
frequency
,
automatically
selected
with
the
fre
-
quency
range
for
internal
sampling.
Ex
-
ternal
sampling
sets
the
full
scale fre-
quency
to 1/
2,56
of
the
external sam-
pling rate
Analog
to
Digital
Conversion:
12-bit
two's
complement.
Quantizing
error
maxi-
mum±
1/ 2 LSB
Overload
Indicator:
Indicates overload in
either
the
input
amplifier
or
the
ADC
Upper
10
dB
Indicator:
Indicates
when
either
the
input
amplifier
or
the
ADC is
operating in
the
upper 10 dB
of
its dy-
namic
range
Analysis
Characteristics
:
Full
Scale
Frequency:
10Hz
to
20kHz
selectable in a 1-
2-5
sequence
Weighting:
Flat (rectangular),
or
Hann
ing
Number
of
Synthesized
Filters:
400,
generated
from
1
024
input
samples
Filter
Spacing,
/3
: reciprocal
of
the
input
record
time
duration
, or
full
scale
fre
-
quency
/
400
3
dB
Bandwidth
: 0,
88/3
for
flat
weight-
ing, and 1,
44/3
for
Hanning
weighting
Noise
Bandwidth
:
/3
for
flat
weighting,
and 1
,5/3
for
Hanning
weighting
Amplitude
Linearity
: (for
32
spectra av-
erage) ± 0,1 dB or ±
0,01%
of
full
scale
at
overload,
whichever
is greater, (no
ad
-
j
ustment
necessary,
two-tone
test)
Frequency
Accuracy
and
Stability
:
0,01
% w i
thout
warm-up
, (no
adjustment
necessary)
System
Frequency
Response:
±
0,2
dB
with
antialiasing
filters
bypassed. or
± 0,3 dB
otherwise,
2Hz
to
20kHz
Noise
Level: (for
32
spectra average)
less
than
0 dB/ 1
1N
or
greater
than
76
dB
below
overload,
whichever
is grea-
ter
Real
Time
Frequency
Range: > 2 kHz
Transient
Analysis:
Trigger
Modes:
Internal,
External,
or
Free-
run
Trigger
Level:
Adjustable
in
200
steps
across
the
input
voltage range. Trigger le-
vel indicated
on
display screen
Trigger
Slope:
positive
for
positive
trig
-
ger level and negative
for
negative
trig-
ger level
After
Trigger
Recording:
Adjustable
in
steps
of
0,1 record
length
from
0,0
to
9,
9 record
lengths
after
trigger
Memory
Period:
equal to in seconds,
400
/
full
scale
frequency
in
Hz
Record
Control:
manual
transient
cap-
ture,
or
automatic
capture on
the
next
trigger
Transient
Averaging:
automatic
averag-
ing
of
a succession
of
transients
,
or
aver-
aging
with
manual
control
after
verifica-
tion
of
data
Averaging
:
Linear:
linear
average of a preset
num
-
ber
of
spectra producing a
true
power
av-
erage. A
true
average is
always
dis
-
played, and
the
number
of
spectra aver-
aged is indicated
on
the
display
Exponential:
the
number
of
spectra indi-
cated on
the
display gives
the
effective
averaging
time
Hold
Max.:
the
maximum
level
occurring
in each
channel
is held
No.
of
Spectra:
1 -
2048
in
12
binary
related ranges
Controls:
Start
, Proceed, and Stop
Memory:
"Store" stores
the
instantaneous
or
aver-
aged
spectrum
and
the
corresponding al-
phanumerics
shown
on
the
display
"Protect"
prevents
further
updating
of
the
memory
Display:
The display screen
shows
the
input
func-
tion, (i .e. time
function
,
instantaneous
spectrum
,
or
averaged spectrum), the
function
stored in
the
memory
,
the
differ-
ence
between
the
input
function
and the
stored
function
, or
the
input
and stored
functions
alternately
with
a fast or
slow
alternating
frequency
Size:
11
"
Display
Area:
150
x
210
mm
(6
in
x
8,25
in)
Scale
Lines: 41
hor
izontal lines are elec-
tronically
generated
directly
on the
screen
for
parallax
free
readings
Line
Frequency
:
20.48
kHz
Frame
Frequency:
47,7 Hz
Spectrum
Range
:
20
dB,
40
dB
or
80dB
Spectrum
Gain
: in 10 dB steps over an
80dB
range
Alphanumeric
Read-outs:
full
scale le-
vel,
fu
II
seale
frequency
. records
after
trigger
,
number
of
spectra averaged, se-
lected
frequency
line
or
sample
number
selected
frequency
or
time
, selected level
Line
Selector:
line
moved
either
continu-
ously
or
in
single steps to
the
right
or
left
, indicated by an
intensified
column
Amplitude
at
Line
Selector:
shown
on
display referenced to
11N
RMS,
or
1pV
RMS
±50
dB in
10
dB steps, or refer-
enced to
the
RMS level in any
other
channel
of
the
spectrum
Time
at
line
selector:
shown
on
display
referenced to
first
sample or relative to
any
sample
in
the
record
Time
Function
Display:
Every
third
sam-
ple,
or
in
expanded mode
390
conti-
guous
samples selectable by
'Time
Func-
tion
Move"
Level
Recorder
Output
:
Output
Impedance:
1
kO
Maximum
Output
Voltage:
+
15
V
(nomi-
nal
12V)
Digital
Input
and
Output
:
IEC
TC
66
Standard
Interface*
for
pro-
grammable
measuring
apparatus
Functions:
SH 1,
AH
1, T 5, L 3,
SR
1,
RL 0 .
PP
0.
DC
0
and
DT 0
Data:
Functions
selected by Display Se-
lector,
or
with
controller,
any
main
me-
mory
block
Code:
ISO
7-bit
code, (i.e. ASCII
but
without
the
parity
bit)
or
binary
(selected
from
controller)
Remote
Control:
Front
Panel settings
can be
input
and
output
via standard
in-
terface
Miscellaneous:
Power
Supply:
100,
115
,
127
,
200
,
220
,
240
V AC ±
10%,
50
to
60Hz,
ap-
prox.
120W
Environment:
temperature
range, (for op-
eration
within
specifications) + 5°C to
+
40
°C
Storage
Temperature
-25
°C to +
75°C
Cabinet:
supplied as model A
(light
-
weight
metal
cabinet)
or
C (as A
but
with
flanges
for
standard
19
" racks)
Dimensions
and
Weight:
(A-cabinet
with-
out
feet)
Height:
310.4
mm
(12
,2 in)
Width
:
430
mm
(16,9
in)
Depth:
500mm
(19
,
7in)
Weight
:
22
kg
(48
,5 lb)
Accessories
Included
:
Mains
cable
AN
0020
1 B & K plug
JP
0101
1 BNC plug JP
0035
Cam disc
for
2307
OD
0253
Remote control cable
for
2307
AQ
0035
Cam
switch
cable
for
2307
and Remote
1 cable
for
2308
AQ
0034
Signal cable
for
2307
AO
0064
Signal
cable
for
2308
AO
0087
X-Y
Recorder
Output
ZN
0204
(optional):
(replaces Level Recorder Output)
X-Deflection:
Read-out
time:
switch
selectable,
45,
118,
263
s
Output
Voltage:
staircase 0 to + 10 V in
400
steps,
(linearity
better
than
0,1
%)
.
Full scale
deflection
in
"
cal"
mode
Output
Impedance:
1
00
n
Y-Deflection:
Output
Voltage:
0
to
+
10
V, in
256
steps (accuracy
better
than
± 10 mV).
Full scale
deflection
in
"cal" mode
Output
Impedance:
1
00
n
Accessories
Available:
Cable
AO
0129
for
connection to
IEC
in-
terface bus
Cable
AO
0157
for
connection
to
IEEE
std
488
interface
bus
Preprinted Level Recorder paper
QP
1103
Preprinted
paper
for
X-Y
Recorder QP
1002
*(IEEE Standard
488
-
1975
and ANSI MC1.1
1975)
2.
CONTROLS
2.1.
FRONT
PANEL
OF
NARROW
BAND
SPECTRUM
ANALYZER
TYPE
2031
The
front
panel
controls
of
the
2031
can be
conveniently
grouped as
follows:
1.
Controls
used
for
analog
input
of
data and
general
operation.
2.
Controls
used
for
recording and
transformation
of
data.
3.
Controls
used in averaging
of
data.
4.
Controls
used in
the
display
of
data.
Many
of
the
controls
have an LED
indicator
to
show
their
status.
The
indicator
comes
on
when
the
function
is active.
2.1.1.
Controls
used
for
Analog
Input
and General
Operation
Preamp. Input
--:!--I
f
•-
Signal Ground
--:::1--=---
t• J
Gain Control
w--~&IMetrllftiAMI\'.Mr
1.,.,_1\l,U
liii
'
ll--
--::--System
Reset
1--::--
Power
On
780023
Fig.2
.
1.
Controls
used
for
Analog
Input
and
General
Operation
13
PREAMP. INPUT
7-pin
input
for
signal
entry
from
most
Bri.iel & Kjcer
Microphone
pream-
plifiers.
Input
impedance 1
MO
in parallel
with
1
00
pF.
Accepts
stand-
ard Bri.iel & Kjcer plug
part
number
JP
0701.
The
connection
diagram
is given in
Fig.2.2.
Heater Voltage
+ 12,6 V (100 rnA)
Heater Voltage
+ 6,3 V (200 rnA)
Signal
Input
Ground
Polarization
Voltage
+ 200 V (10
J.LA)
780028
Fig.2.2.
Connection diagram,
2031
PREAMP. INPUT,
external
view
DIRECT INPUT Co-axial
input
to
the
2031.
Input
impedance 1
MO
in parallel
with
1
00
pF. Accepts standard Bri.iel & Kjcer plug
part
number
JP
01 01
or
BNC adapter
part
number
JP
0144.
Maximum
input
voltage,
250V
RMS (sine), see
Section
3.1.
SENSITIVITY
Two
screwdriver
operated
potentiometers
placed
below
their
respective
INPUTS,
allowing
the
input
gain
to
be adjusted to compensate
for
dif-
fering
transducer
sensitivities.
They operate
independently
over a
range
of+
4,7dB
to
-10dB.
REFERENCE
ADJUST
dB
Allows
adjustment
of
the
2031
reference level in steps
of
10 dB.
When
it
is set
to
"0",
then
assuming
the
input
gain
is
correctly
ad-
justed,
the
reference level is 1JiV RMS. Range
of
adjustment,±
50
dB.
GAIN CONTROL Gives
continuous
adjustment
of
the
input
amplifier
gain.
When
set
to
"Cal.",
the
gain
is
set
to
maximum.
The
maximum
variation
from
this
position is
approximately
-1
0 dB. Operates
simultaneously
on
both
the
PREAMP. and DIRECT INPUTS.
UNCAL
Indicator
showing
when
the
GAIN CONTROL is
not
set
to
"Cal.".
OVERLOAD Indicates
when
either
the
input
amplifier
or
the
ADC is overloaded.
UPPER 10 dB Indicates
that
either
the
ADC
or
the
input
amplifier
is operating in
the
upper
10
dB
of
its
dynamic
range.
INPUT
"Preamp."-
connects
the
PREAMP. INPUT
to
the
input
amplifier.
14
"Direct"
-connects
the
DIRECT INPUT
to
the
input
amplifier.
"Reference
1
00
dB
11V"
-
injects
a reference signal
into
the
selected
INPUT
for
internal
calibration
adjustment.
With
a
correctly
adjusted
in-
put
gain
and
the
REFERENCE
ADJUST
dB set to
"0",
the
amplitude
of
the
signal is 1
00
dB RMS referred
to
11J.V.
The
frequency
of
the
signal
is derived
from
the
sampling
frequency
such
that
it
always
falls
at
the
centre
of
line
number
256
of
the
resulting
spectrum,
irrespective
of
the
F.S. FREQUENCY SETTING.

Other BRUEL & KJAER Measuring Instrument manuals

BRUEL & KJAER 2203 User manual

BRUEL & KJAER

BRUEL & KJAER 2203 User manual

BRUEL & KJAER 2212 User guide

BRUEL & KJAER

BRUEL & KJAER 2212 User guide

BRUEL & KJAER 4440 User manual

BRUEL & KJAER

BRUEL & KJAER 4440 User manual

BRUEL & KJAER 4294 User manual

BRUEL & KJAER

BRUEL & KJAER 4294 User manual

BRUEL & KJAER Mediator 2238 Guide

BRUEL & KJAER

BRUEL & KJAER Mediator 2238 Guide

BRUEL & KJAER 2307 Original operating manual

BRUEL & KJAER

BRUEL & KJAER 2307 Original operating manual

BRUEL & KJAER 1616 User manual

BRUEL & KJAER

BRUEL & KJAER 1616 User manual

BRUEL & KJAER 2240 User manual

BRUEL & KJAER

BRUEL & KJAER 2240 User manual

BRUEL & KJAER 2204 User guide

BRUEL & KJAER

BRUEL & KJAER 2204 User guide

BRUEL & KJAER 4511-W-006 User manual

BRUEL & KJAER

BRUEL & KJAER 4511-W-006 User manual

BRUEL & KJAER 4152 User guide

BRUEL & KJAER

BRUEL & KJAER 4152 User guide

BRUEL & KJAER 2825 User manual

BRUEL & KJAER

BRUEL & KJAER 2825 User manual

BRUEL & KJAER 2245 User manual

BRUEL & KJAER

BRUEL & KJAER 2245 User manual

BRUEL & KJAER 4809 User guide

BRUEL & KJAER

BRUEL & KJAER 4809 User guide

BRUEL & KJAER 4824 User manual

BRUEL & KJAER

BRUEL & KJAER 4824 User manual

BRUEL & KJAER Matron 3 User manual

BRUEL & KJAER

BRUEL & KJAER Matron 3 User manual

BRUEL & KJAER 4720 Guide

BRUEL & KJAER

BRUEL & KJAER 4720 Guide

BRUEL & KJAER 4204 User manual

BRUEL & KJAER

BRUEL & KJAER 4204 User manual

BRUEL & KJAER HBK Z6AM User manual

BRUEL & KJAER

BRUEL & KJAER HBK Z6AM User manual

BRUEL & KJAER UA-1480 Operating and maintenance manual

BRUEL & KJAER

BRUEL & KJAER UA-1480 Operating and maintenance manual

BRUEL & KJAER 9737 User manual

BRUEL & KJAER

BRUEL & KJAER 9737 User manual

BRUEL & KJAER 2513 User manual

BRUEL & KJAER

BRUEL & KJAER 2513 User manual

BRUEL & KJAER 2211 User guide

BRUEL & KJAER

BRUEL & KJAER 2211 User guide

BRUEL & KJAER BK Connect 9712-W-FEN User manual

BRUEL & KJAER

BRUEL & KJAER BK Connect 9712-W-FEN User manual

Popular Measuring Instrument manuals by other brands

HT HT9020 user manual

HT

HT HT9020 user manual

RND 365-00004 user manual

RND

RND 365-00004 user manual

RigExpert AA-650 ZOOM user manual

RigExpert

RigExpert AA-650 ZOOM user manual

Swan Analytical Instruments AMU Inducon Operator's manual

Swan Analytical Instruments

Swan Analytical Instruments AMU Inducon Operator's manual

Lafayette Instrument ACUMAR quick start guide

Lafayette Instrument

Lafayette Instrument ACUMAR quick start guide

WIKA DIH10 operating instructions

WIKA

WIKA DIH10 operating instructions

SatLab Freyja GNSS RTK user manual

SatLab

SatLab Freyja GNSS RTK user manual

Keysight N5227B Service guide

Keysight

Keysight N5227B Service guide

Beckhoff EL3692 Documentation

Beckhoff

Beckhoff EL3692 Documentation

LaserLiner RollPilot Mini manual

LaserLiner

LaserLiner RollPilot Mini manual

Fluke FL700G01 user manual

Fluke

Fluke FL700G01 user manual

REED R3530 instruction manual

REED

REED R3530 instruction manual

Omega DPG409 SERIES user guide

Omega

Omega DPG409 SERIES user guide

iCeeO2 500 instruction manual

iCeeO2

iCeeO2 500 instruction manual

Aceinna IMU381 SERIES user manual

Aceinna

Aceinna IMU381 SERIES user manual

MULTISPAN MFM 14DC manual

MULTISPAN

MULTISPAN MFM 14DC manual

Hanna Instruments HI 771 instructions

Hanna Instruments

Hanna Instruments HI 771 instructions

Sealey Auto Service Series instructions

Sealey

Sealey Auto Service Series instructions

manuals.online logo
manuals.online logoBrands
  • About & Mission
  • Contact us
  • Privacy Policy
  • Terms and Conditions

Copyright 2025 Manuals.Online. All Rights Reserved.