Introduction
1
Thank you for purchasing the HIOKI "Model 8847 Memory HiCorder."
This Measurement Guide consists of some basic application examples. Before
using the instrument, be sure to read the Instruction Manual carefully.
The following documents are provided with this instrument. Refer to them as appropriate for your applica-
tion.
Contents
Introduction
Document Description
1Measurement Guide
(This document)
Read first.
Offers an introduction to the Memory HiCorder's basic measuring method for first
time users.
2Instruction Manual Contains explanation and instructions regarding the instrument's operating meth-
od and functions.
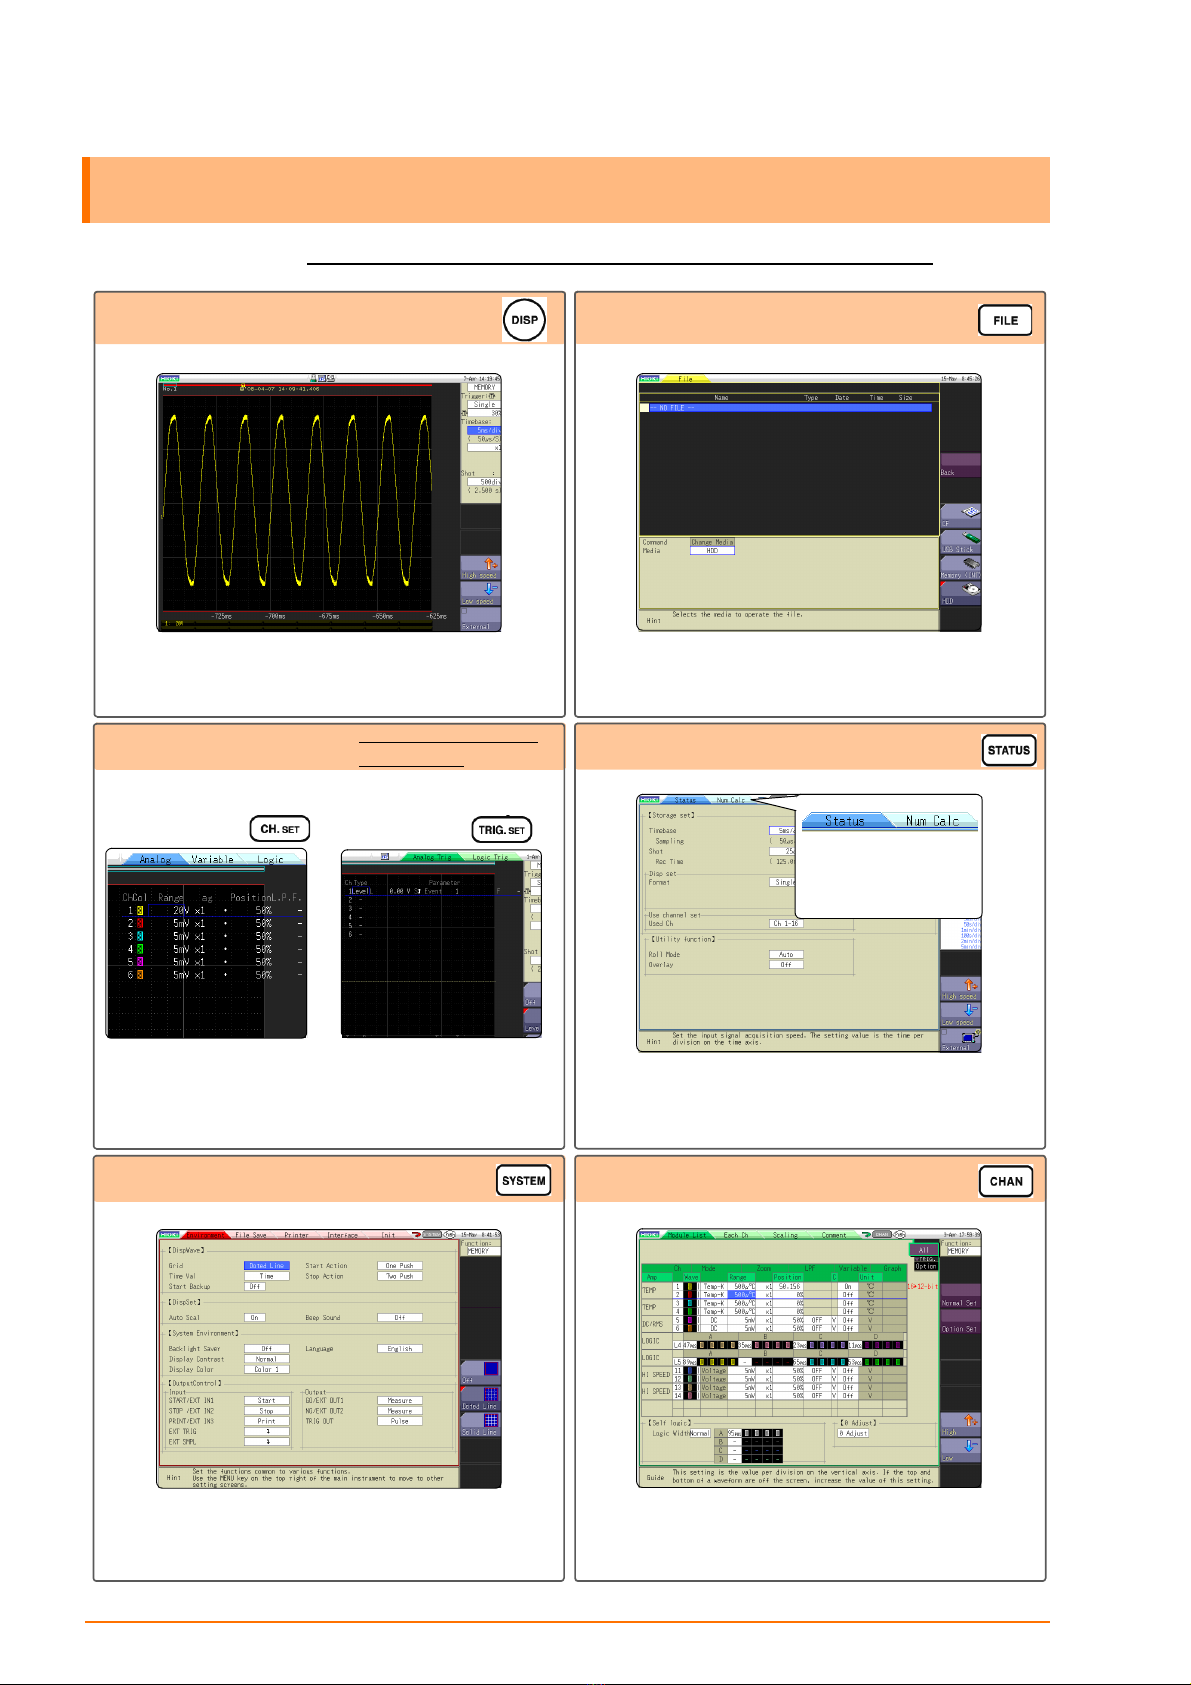
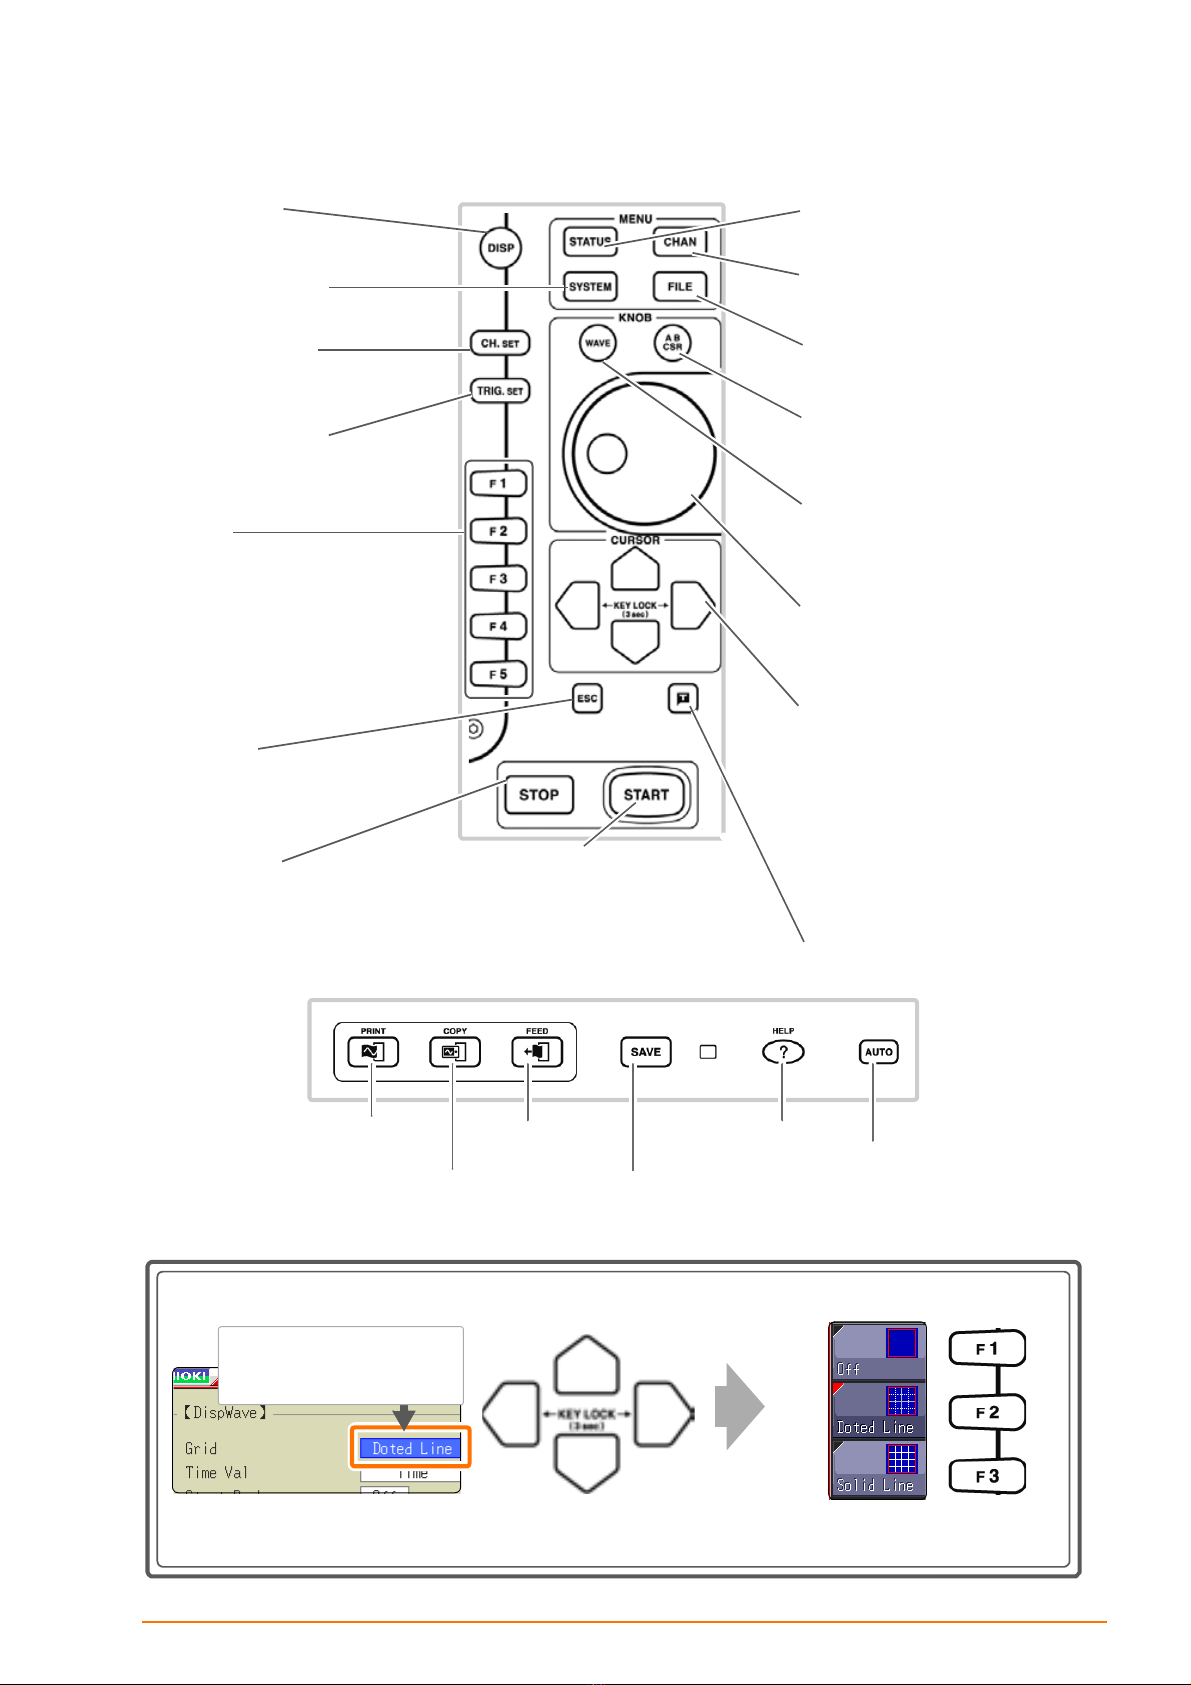
Screen structure and
operation overview The following explains the screen structure and overview of the
operation keys of the main instrument. (p.2)
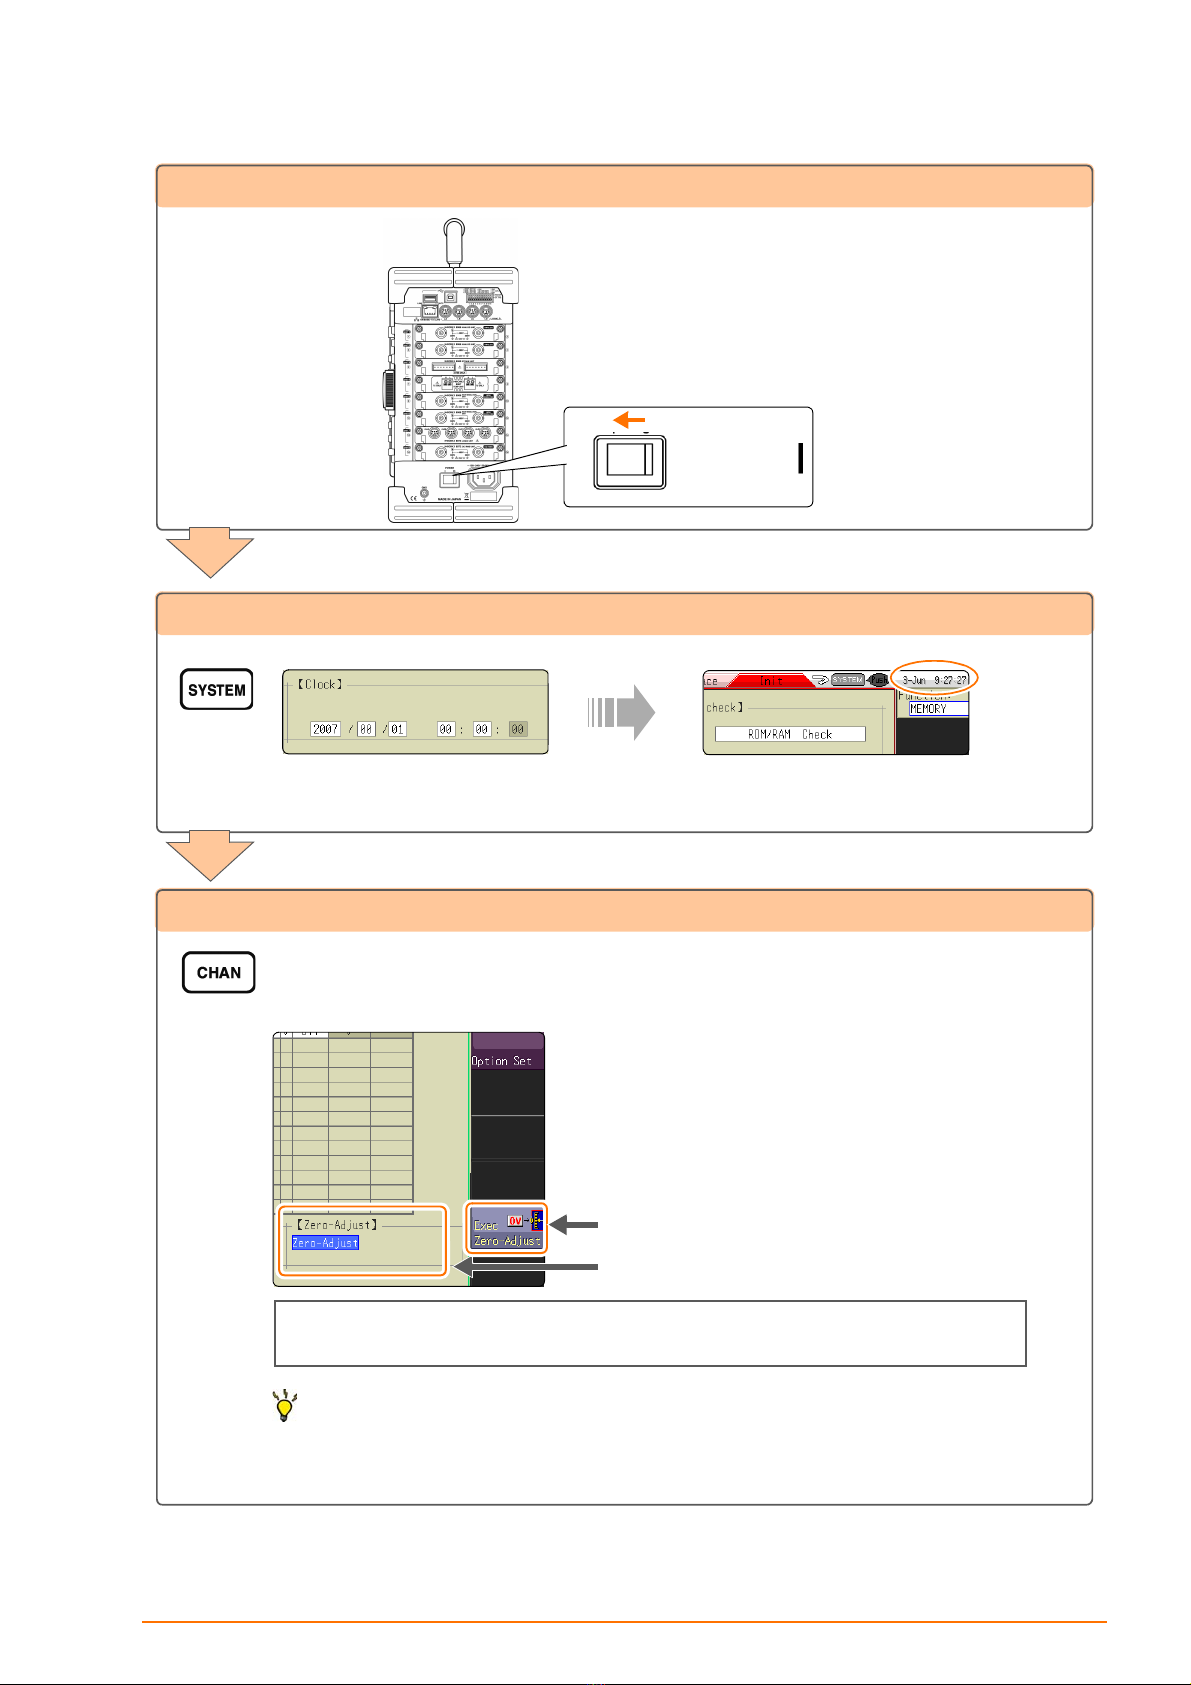
Measurement Prepara-
tions The following explains the things to be done before carrying out
measurement. (p.4)
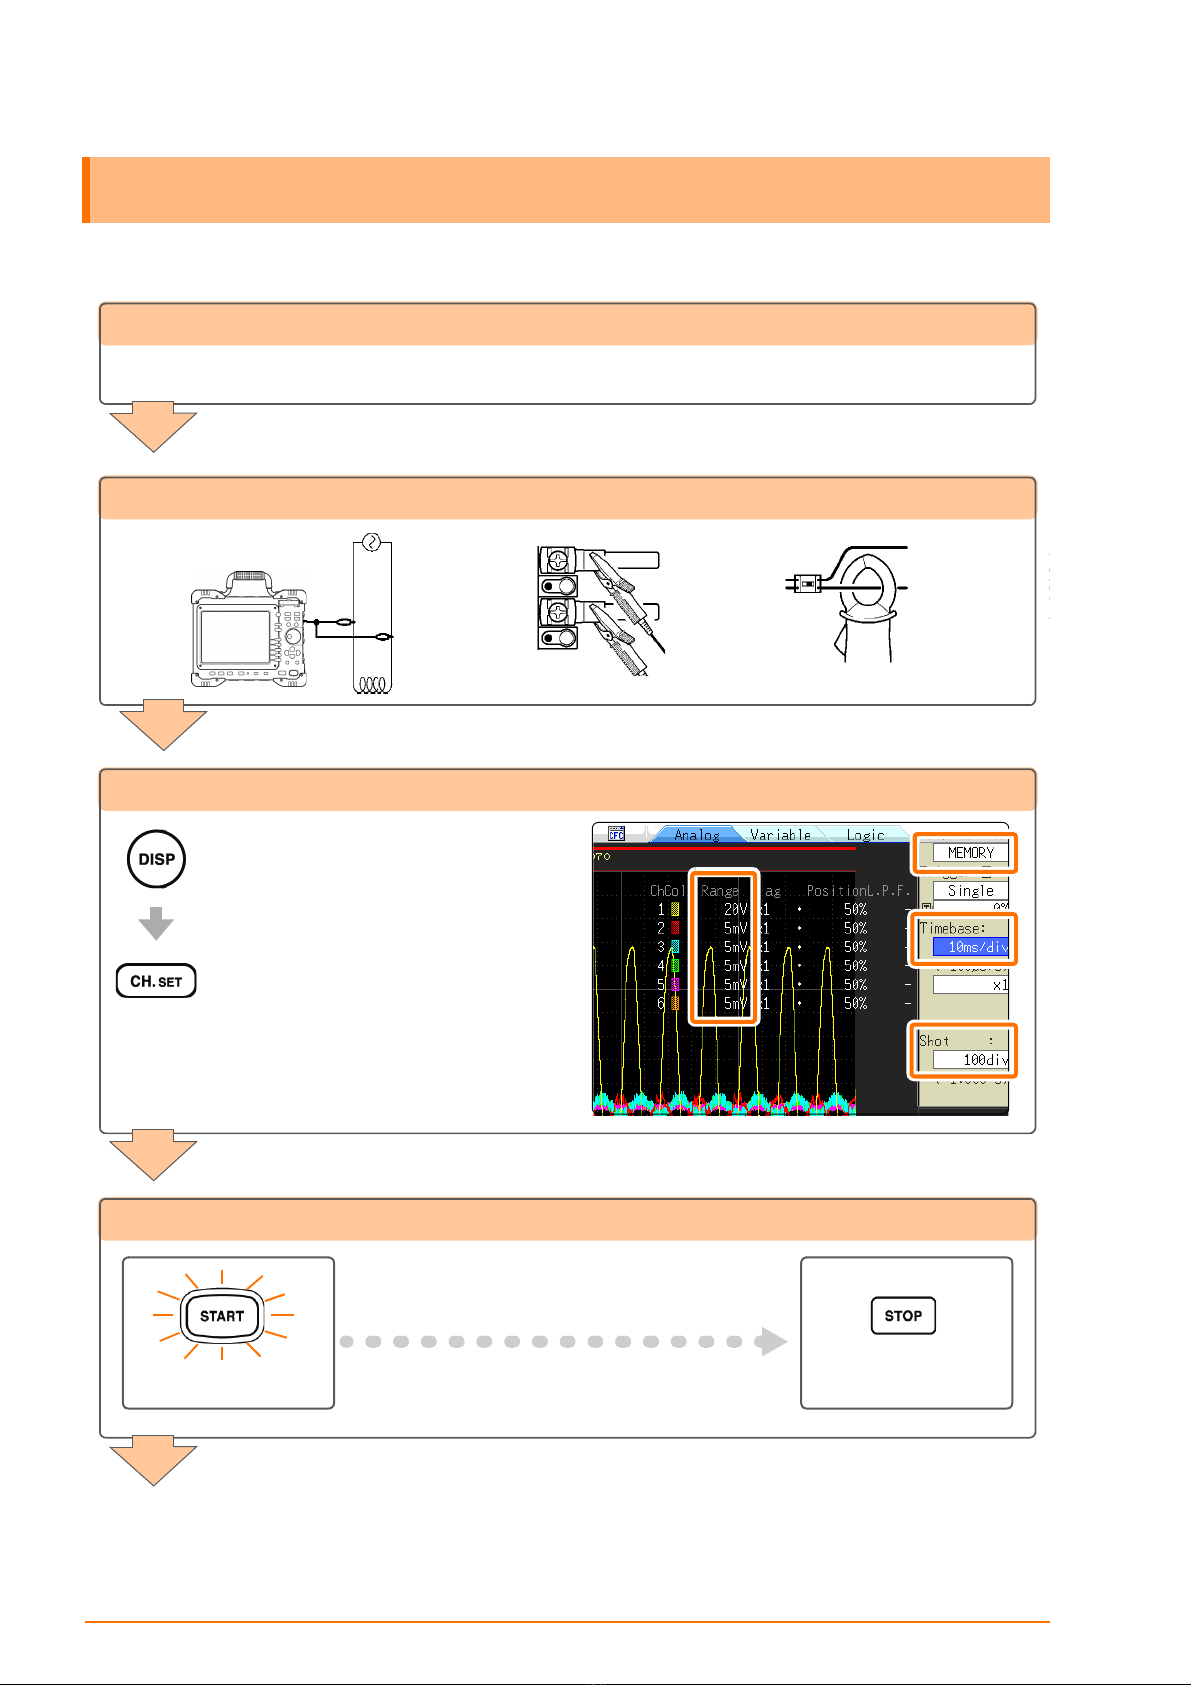
Measurement Procedure The following explains the flow from pre-measurement check to
analysis/saving/printing. (p.6)
Measure the commer-
cial power supply
The following explains how to record waveforms of a commer-
cial power supply of 100 V.
The following explains how to save the data. (p.8)
Monitor abnormal occur-
rences
The following explains how to record a voltage dip caused by a
special occurrence such as a black out.
Using the trigger function to carry out constant monitoring, only
the abnormal occurrence can be recorded.
The following explains the method to automatically save data.
(p.10)
Analyze
Waveform measurement value can be viewed or calculated us-
ing the A/B cursor.
The following explains how to display the measured waveform
without overlapping.
(p.12)
Print The following explains the printing method. (p.17)
Convenient functions The following explains the auto range function, pre-trigger and
probe compensation. (p.19)
Others The following are explanations for the screen, time axis and
sampling, record length setting, voltage axis and optical resolu-
tion, and file transfer speed. (p.21)