Huazheng HZ-600A User manual

HZ-600A
Sweep Frequency Response
Analyzer
User Manual
Huazheng Electric Manufacturing (Baoding) Co., Ltd

Dear use r:
Thank you for cho os in g HZ-6 00 A Sweep Freq ue nc y Response Analyzer.
We hope that thi s instrum en t can make your work eas ier and more
enjoyable, so that you can get the feel ing of office automation in the te st
and ana ly si s work.
Before usin g the inst ru me nt , ple as e read this manual, and operate and
maintain th e instrum en t according to the manual to prolong its se rvice life.
"Just a li gh t pre ss, the test will be completed automatically " is the
operating chara ct eristi cs of this instrum en t.
If you are sat isfied wi th th is inst rument, please tell yo ur colleagues;
if you ar e not sa tisfied with this inst ru ment, please ca ll (0312) 6775656 to
tell you to serve you at all times-Baoding Huazheng Electric Manufact urin g
Co. , Ltd., our company will def in itely make you sati sf ied !

1
Contents
I. Overview.......................................................................................................................................2
II.Main functions and features........................................................................................................ 2
III.Main Technical index................................................................................................................... 3
IV.Method of operation.................................................................................................................... 3
V.Tester Maintenance........................................................................................................................ 13
VI.Precautions.................................................................................................................................13
VII.Ordering and Service...................................................................................................................15
VIII.Packing list................................................................................................................................15
Appendix 1: The relationship between the correlation coefficient and the degree of
transformer winding deformation................................................................................................. 16

2
I. Overview
The Sweep Frequency Response Analyzer is used for power transformer with voltage
grade of 6kV and above and other transformers with special purpose. The power
transformer is inevitably vulnerable to impulse of various fault short-circuit current or
physical collision in the process of operation and transportation and the transformer
windings may lose stability under the powerful electro-dynamic force exerted by such
short-circuit current, which could result in permanent deformations such as local distortion,
swell or dislocation and will severely affect safe operation of the transformer. Deformation
of transformer windings is measured with frequency response analysis method according
to national standard DL/T911-2016/IEC60076-18 for electric power industry, i.e. detect
amplitude-frequency response characteristic of each transformer winding and make
vertical or horizontal comparison of the detection result to judge possible deformation of
the transformer winding based on change of amplitude-frequency response
characteristics.
II.Main functions and features
1.Characteristics of transformer windings are measured with frequency sweep method.
Deformations of windings such as distortion, swell or displacement of 6kV and above
transformer are measured by detecting amplitude-frequency response characteristics of
each winding, not requiring lifting of transformer enclosure or disintegration.
2.Quick measuring, measuring of a single winding is within 2 minutes.
3.High frequency accuracy, higher than 0.001%.
4.Digital frequency synthesis, with higher frequency stability.
5.5000V voltage isolation fully protects safety of the testing computer.
6.Able to load 9 curves at the same time and automatically calculate parameters of each
curve and diagnose winding deformations to provide the reference diagnosis conclusion.
7.Analysis software has powerful functions and software and hardware indicators satisfy
national standard DL/T911-2016/IEC60076-18.
8.Software management is humanized with high degree of intelligence. You only need to
click one key to complete all measurements after setting of parameters.
9.The software interface is concise and vivid, with clear menus of analysis, save, report
export, print, etc.
10.Use windows platform compatible with Windows 2000/Windows XP/Windows
7/windows 8/Windows10.
11.Use database to save test data and render concise and easy data management.
12.Able to load 9 curves at the same time and automatically calculate parameters of each
curve and diagnose winding deformations to provide the reference diagnosis conclusion.

3
13.Software management function is powerful that takes into full account of site use
demand. Measuring data is automatically saved and exported to form Word version test
report (require installation of relevant Office software) or JPG photo report to facilitate the
user to export test report.
14.The software has distinctive humanized feature. Measuring conditions are mostly
options, which exempt the need of many inputs and bring about easier operation.
15.The software has high degree of intelligence. You only need to click one key to
complete all measurements after connection of input and output signals.
16.The software interface is concise, vivid and practical.
III.Main Technical index
1.Measuring speed: 1 min- 2 min for single-phase winding
2.Output voltage: Vpp-25V, adjusting automatically in test
3.Output impedance: 50Ω
4.Input impedance: 1MΩ (the response channel is built with 50Ω matching resistance)
5.Frequency sweep scope: 10Hz-2MHz
6.Frequency accuracy: 0.001%
7.Frequency sweep manner: linear or logarithmic, frequency sweep interval and number
of sweep points are freely settable
8.Curve display: Mag-freq. curve
9.Measuring dynamic range: -100dB~20dB
10.Power source: AC100-240V 50/60Hz
11.Net weight: 3.6kg
IV.Method of operation
1.Operation Flow of System
Ground collector
Connect collector and transformer winding
Connect collector and computer
Start up computer
Power on collector
Log in software
Input information
Select end-frequency and adjust testing parameter
Select winding
Start testing
Replace test winding
Select winding
Start test

4
Repeat above process until all winding tests are done
Analyze data
Export report
Turn off software
Power off collector
Disconnect collector and computer
Remove transformer winding
Test completed.
2.Preparation
Note: basic operations of computer and Windows operating system are not contained
in the operation instructions. Please refer to relevant computer books.
Note: basic operations of Windows operating system involved in the operation
instructions are based on Windows 7 operating system. The differences in operation
between other Windows system and Windows 7 system are not contained in the operation
instructions, for which please refer to relevant computer books.
3.Test Wiring
3.1Panel Introduction
Panel of the Sweep Frequency Response Analyzer is as shown in Figure 1.
Figure 1a Figure of Sweep Frequency Response Analyzer Panel (Front Panel)
Figure 1b Figure of Sweep Frequency Response Analyzer Panel (Rear Panel)
External wiring illustration during the Sweep Frequency Response Analyzer is as shown
in Figure 2. Frequency sweep voltage signal is input from excitation end of the tester to
initial end of the tested transformer winding through input resistance (internal resistance),
voltage signal at the initial end to input end of the tester and voltage signal at the tail end
of the tested transformer winding to response end of the tester. “Ground” of the Sweep

5
Frequency Response Analyzer as well as enclosure and core of the “tested transformer”
are grounded together.
3.2 Winding Wiring Mode
Figure 2 Wiring type
It is recommended to input frequency sweep signal of winding deformation frequency
response test from tail end of winding and output from initial end, suspended for
non-tested winding. Wiring mode of winding deformation test varies with different wiring
group of the transformer.
YN Wiring
Input impedance of frequency sweep signal is connected to neutral point O and output
impedance to A, B and C respectively. For the measuring method, interference signal
received by non-measured phase is absorbed by low impedance of the signal generator,
as shown in Figure 3.
Figure 3 YN Wiring
Y Wiring
It is required to wire in the following manner as neutral point has no outgoing wire, as
shown in Figure 4.
In this test, input impedance is connected to A and output impedance to B.
In this test, input impedance is connected to B and output impedance to C.
In this test, input impedance is connected to C and output impedance to A.
Figure 4 Y Wiring

6
Interior Connection △Wiring
Wiring mode of interior connection △wired winding is as shown in Figure 5.
In this test, input impedance is connected to c and output impedance to a,on behalf of a
phase.
In this test, input impedance is connected to a and output impedance to b,on behalf of b
phase.
In this test, input impedance is connected to b and output impedance to c,on behalf of c
phase.
Figure 5 Interior Connection Δ Wiring
Theoretically, the two non-measured windings that are connected in series first and
then connected with the circuit in parallel in interior connection Δ wiring mode have some
effect over the testing process. However, it is believed that their effect over the
non-measured coil is negligible when attenuation is more than 10dB.
Exterior connection Δ wiring
Wiring mode when windings are disengaged in measurement is as shown in Figure 6.
It is regarded interior connection Δ wiring if connections are not disengaged, when the
wiring mode is as shown in Figure 7.
In this test, input impedance is connected to x and output impedance to a,on behalf
of a phase.
In this test, input impedance is connected to y and output impedance to b,on behalf
of b phase.
In this test, input impedance is connected to z and output impedance to c,on behalf
of c phase.

7
Figure 6 Exterior Connection Δ Wiring
Transformer with Balance Winding
The transformer with balance winding must be ungrounded in test, as shown in Figure 7.
Figure 7 Wiring of Balance Winding
4.System Test
4.1 Start of “SFRA test” Program
1) Double click the icon of “SFRA test” to start the program of “transformer winding
deformation test system”.
2) Enter the main program interface titled “Sweep Frequency Response Analyzer” after
the start process (double click the small icon at the top left corner of the screen to
switch to the desktop. Please do not click the icon in the process of test.)
The software main interface consists of 7 parts:
(A)Test Curve Display Area
The area displays test curve with frequency as X-coordinate and dB value with
Y-coordinate (amplitude-frequency test) or angle value (phase-frequency test). The label
below consists of:
Curve type label: to mark the current display is “amplitude-frequency curve” or
“phase-frequency curve”. Click the label to switch between the two types (require
hardware support).
Sweep mode label: to display the current sweeping mode is linear sweeping or logarithmic

8
sweeping. Click the label to switch between the two modes.
Start frequency label: to display start frequency of current sweeping. Click the label to
switch among different start frequencies.
Stop frequency label: to display stop frequency of current sweeping.
Sweeping point number label: to display total point number of current sweeping. Click the
label to switch among different point numbers.
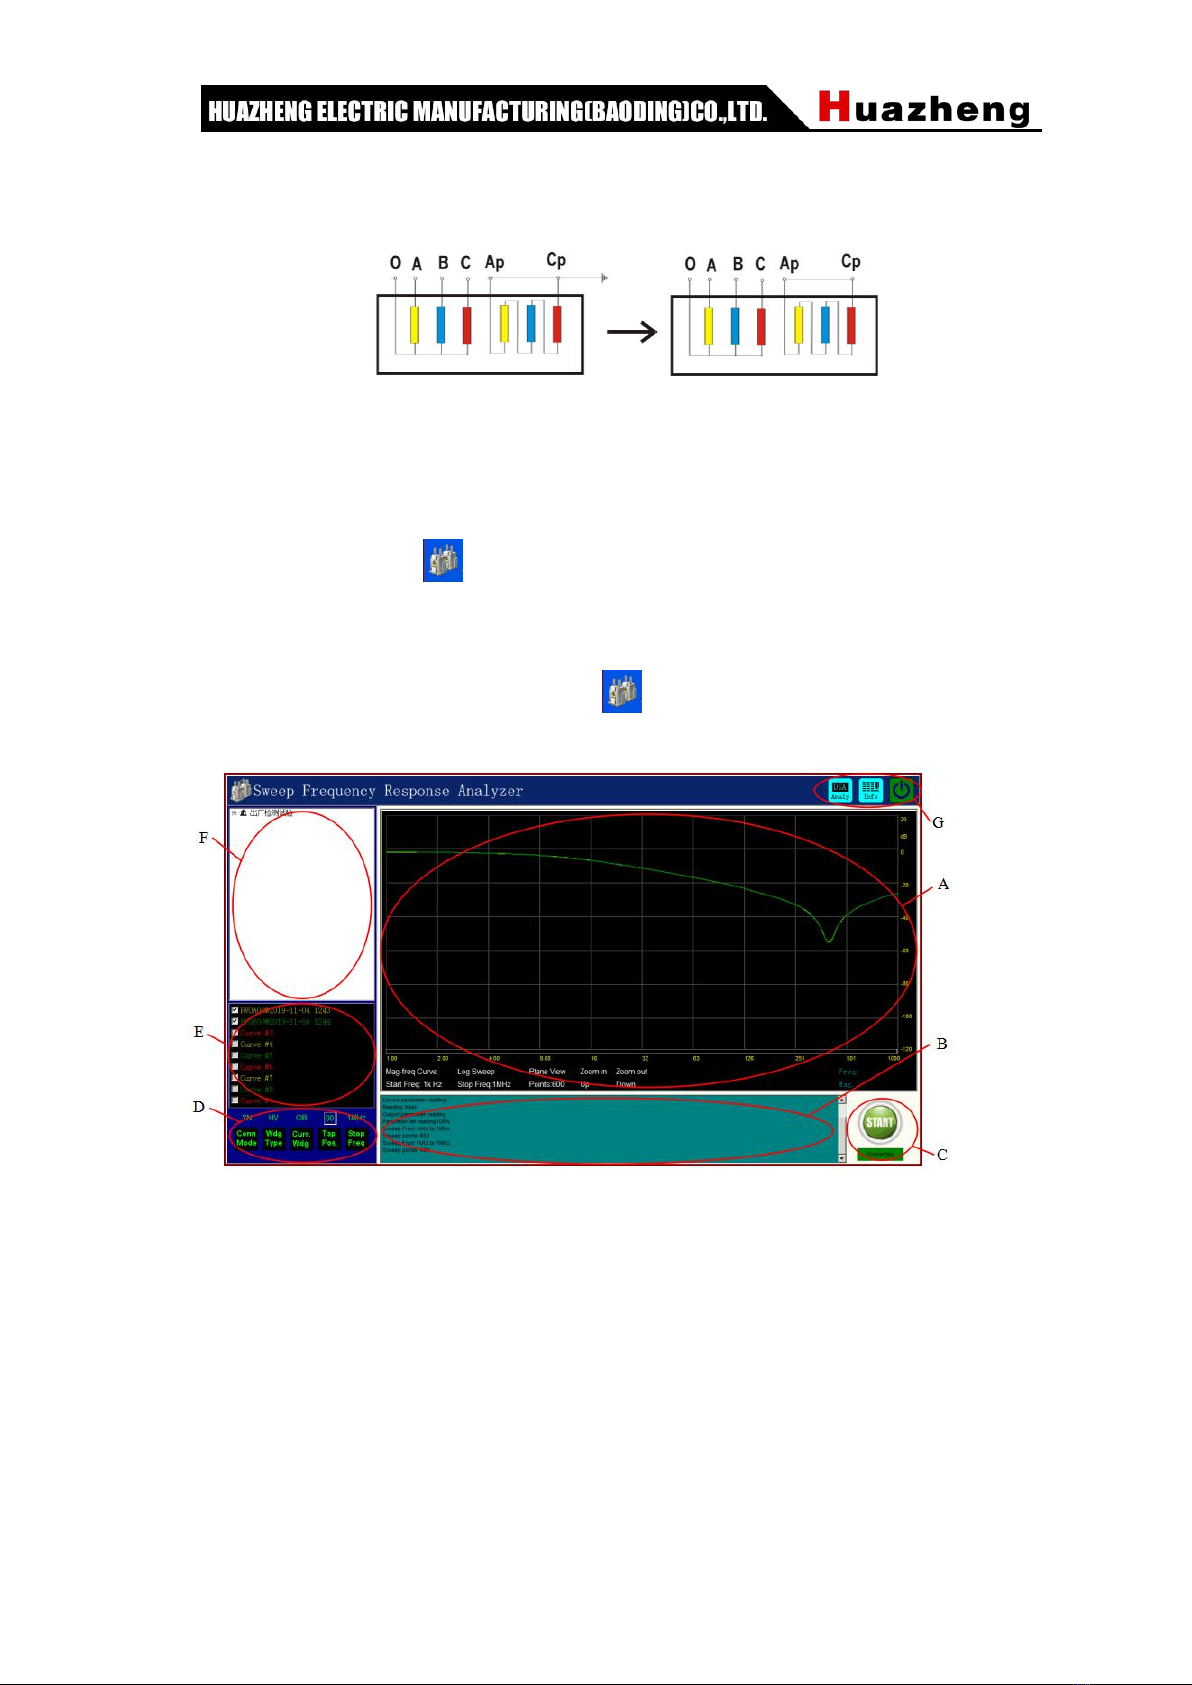
(B)Status Display Area
The status display area displays working status of the current equipment.
(C)Operating Zone
There are two keys in the operating area, start and stop that display in turn
according to service status, i.e. “start” displays under stop status and “stop” under start
status.
There is a current status display label under the key to display current status of the tester:
“Offline status”: computer is working under off-line status, when only data reading and
printing functions are available.
“Equipment connected”: computer is connected with equipment and testing is possible.
“Equipment disconnected”: computer is disconnected with equipment and testing is
impossible, generally requiring reconnection and restart of software.
(D)Test Parameter Setting Area
Area D displays parameter setting window that is used for setting of test parameters,
including winding wiring method, category , Tap position and number of the winding to be
tested, sweep stop frequency, etc.
(E)Curve Description Area
Area E displays description information of the current curve. The label in a color contains
description information of its corresponding curve in the same color.
(F)Data Selection Area
What locates at the top right corner (F) is data selection area. Test data applies
hierarchical management, where the first grade is name of substation, the second grade
name of transformer, the third grade category and number of transformer winding and the
last grade existing data. Data name is displayed in the manner of “data type @ test time”.
Data displayed in the part matches with content of the label in area (A). When
“amplitude-frequency curve” is displayed, the data selection area displays test result of
the amplitude-frequency curve and when “phase-frequency curve” is displayed, the data
selection area displays test result of the phase-frequency curve.
When “amplitude-frequency curve” or “phase-frequency curve” is displayed, the test result
is displayed in area A when relevant data is clicked.
(G)Function Key Area

9
Keys in the function key area (G) will switch automatically and display dynamically based
on the use function.
“DSA analysis”: used for correlation analysis.
“Information Show”:used for show/hide information input-plane.
Quit system.
4.2 Frequency Response Method Test
Environment and Wiring Confirmation
1、The system is wired according to requirements of 3.2 winding wiring mode.
2、Tap position of the transformer is adjusted to the maximum impedance position (the
first tap)
3、The surrounding environment is free from strong electromagnetic interference.
Software Log-in
Double click the icon of “Sweep Frequency Response Analyzer” on the desktop.
The system will flash through the welcome interface and then enter the test interface. The
system will have following dialogue box if equipment is not connected:
Occurrence of the above dialogue box is generally caused by connection failure of
equipment. In this case, first check whether equipment is connected to USB interface of
the computer and then check whether equipment power supply is switched on.
Information Input
Transformer information log-in interface (as shown in the figure below) is entered when
equipment is connected, where you may input or select information in relevant textbox
and click save key so that the system will enter the test interface.

10
Please input carefully according to the transformer nameplate while inputting information
as all information is automatically saved together with the test result and incorrect input
may affect the contents of the report.
Sweeping Mode Confirmation and Modification
1、Selection of Sweeping Mode
Click “Stop Frequency” to select test stop frequency and then the system will
automatically set parameters to the set parameters according to the set sweeping
parameters, including start frequency, sweeping mode, and sweeping point number. To
adjust, click the parameter label in area A to switch automatically (the label automatically
turns green when the mouse pointer moves to a changeable label).
2、Change of Default Information
To readjust the default setting information, click “Stop Frequency” key with right
mouse button to let the function menu pop up. The information setting window (as shown
in the figure below) will pop up when “setting” is selected, where you may adjust the
default sweeping information and restart the software after adjustment. Then the system
will test with the adjusted default information.

11
The above adjustment is used for setting of default information that is distinguished by the
value of “stop frequency”. Actually, adjustment is generally performed as required during
the first time use in practical application and is not performed later unless there is
regulation or special requirement.
3、Change of Sweeping Parameters
Change of sweeping parameters is used for testing of complicated parameter
combinations. The system doesn’t have memory function and will recover automatically
once quit.
Click parameter label in the curve display area (A) before sweeping to change information
other than stop frequency in the manner of cyclic adjustment.
Change of sweeping parameters is applicable to single test with measuring result
requirement or for the sake of research, generally not requiring adjustment.
Test
You may start data measurement with frequency response method after setting of basic
test information. The system will automatically complete frequency sweep after “START”
key is clicked. The key will turn to key in the process of test that could stop the
current sweeping once clicked. The test pauses once the signal curve display area is
clicked and proceeds when clicked again.
After completion of a test item, change the wiring mode, change software setting
information, click again key, measure the next item and repeat the above operations
until all measurement items are completed.
The test waveform display area is unfolded when the test curve display area (A) is double

12
clicked in the test process, which contains waveform display, input voltage peak value
(red), response voltage peak value (yellow), amplification factor and X-coordinate time
information used for signal research.
4.3 Correlation Analysis
Curves in area E are automatically divided into three groups, 1-3 as a group, 4-6 as a
group and 7-9 as a group and correlation analysis of each group of curves is performed
inside the respective group. Once is clicked, report display window will pop up at
the left side that displays contents of the current test report. The operator may reconfirm
and re-input information and click on the report display window to let the save
dialogue box pop up, where the operator may set file name, file type and save path. The
result is saved in “FRA_data” of disk D by default with file name of “print report” + “print
time”.

13
4.4 Data Echo
The system is able to echo saved data. By selecting name of power station, name of
transformer, test category and time, as well as winding type and time in turn in area F, the
completed test result is called out. By default, the data is displayed at the position of the
first curve and displayed downwards with progressive increase of the selection result.
When the number of curves comes to the maximum (9 curves), the curve no longer
increases and you may select the curve to be replaced for progressive replacement in this
case. When a curve is decided not requiring analysis, you may right click “clear curve” on
the curve description information (E) so that the curve will be removed out of the analysis
list automatically.
Curves in area E are automatically divided into three groups, 1-3 as a group, 4-6 as a
group and 7-9 as a group and correlation analysis of each group of curves is performed
inside the respective group. Therefore, it is required to ensure the curves to be analyzed
are within the same group, or otherwise you cannot get correct analysis result.
When “analysis” is clicked after selection of curve, the report display window will
pop up at the left side. All other operations are the same as operations described in 4.3.
4.5 Report Saving Position
Report is saved under folder of disk D with the folder hierarchy of:
D: \FRA_data\test report+ print time. doc or test report+ print time. jpg.
The report could be WORD document or JPG photo, subject to the option selected in
saving.
V.Tester Maintenance
The section provides basic maintenance data. Please do not try to disintegrate, modify
and repair the Sweep Frequency Response Analyzer.
5.1 Basic Maintenance
Regularly scrub surfaces of the tester and its accessories with a clean cloth.
Put the tester at a clean place with low humidity and protect it against entry of dirt and dust.
Put the tester into its packing case when not used and keep the packing case level.
5.2 Senior Maintenance
To be proceeded by professional technicians of the Company.
VI.Precautions
Please read carefully the Instructions for the Sweep Frequency Response Analyzer!
Operators must read carefully the Instructions before use.
The tester is applicable to testing of transformer winding deformation with frequency
response method.

14
Equipment irrelevant to the tester cannot share power supply terminal with the tester.
Power supply of the system must be provided with reliable grounding to prevent the
risk of electric shock.
Operators cannot leave the test site in the process of equipment operation.
The transformer core must be reliably grounded with enclosure. Shell of tester and
shell of measuring impedance must be reliably grounded with transformer enclosure.
Please do not start test before “ground” of the tester is correctly connected.
Please fully discharge terminal of the transformer to be tested before test.
Before use, please check appearance of the tester and check whether its power
switch is at “closed” position and every wiring terminal is normal.
Winding deformation test must be carried out on the conditions that all leads of the
transformer (including overhead line, enclosed busbar and cable) are disconnected and
far from the transformer bushing to the extent possible (surrounding grounding body and
metal suspended solids must leave the transformer casing by more than 20cm),
especially for the transformer connected with enclosed busbar.
Correctly record positions of tap switches before test and put tap switches of the
tested transformer at the first tap as far as possible, especially for the on-load regulating
transformer, in order to achieve complete winding information. For no-load regulating
transformer, make sure every measurement is made at the same tap position for easy
comparison.
Make sure wiring clamp of the measuring impedance tightly contacts bushing clip. In
case of conductive paste or rust on the bushing clip, scrub it clean with abrasive cloth or
dry cotton cloth.
Do not start any software irrelevant to measurement while using the tester.
The tester with use of general operating system has the risk of system bug and
collapse.
Generally, system abnormalities may be eliminated by restart of system software.
Please do not use the system in rainy and foggy days as it is not water-proof.
Put the tester into its packing case when not used and keep the packing case level.
The scrapped equipment must be handled according to requirements of national laws
and regulations or handed to the Company for handling.
Please directly contact our after-sales service department if you have any doubt after
reading the instructions.

15
VII.Ordering and Service
7.1 Damages of the tester as a result of product quality issue within three years since its
delivery will be repaired free of charge; for damages due to other reasons, the Company
only charges repair cost.
7.2 We provide lifetime maintenance and technical services for the products.
7.3 Please contact us immediately upon discovery of any abnormality in the tester. We
will provide the most convenient solution for you. DO NOT disassemble the tester!
VIII.Packing list
No.
Name
Qty
1
Collector Module
1
2
Excitation Cable(Red)
2
Respons Cable(Yellow)
1
Ground Cable& Pincers
2
Excitation Pincers(Red)
1
Respons Pincers(Yellow)
1
3
USB Cable
1
4
Y tee
2
5
Power Cable
1
6
PE Cable
1

16
Appendix 1: The relationship between the correlation coefficient and the degree of
transformer winding deformation
The transformer winding deformation tester of our company strictly follows the power
industry standard DL/T911-2016 "Frequency Response Analysis Method of Power
Transformer Winding Deformation" to analyze the degree of transformer winding
deformation. The relationship between the specific correlation coefficient and the degree
of transformer winding deformation is shown in the following table :
Table A.1 The relationship between correlation coefficient and transformer winding
deformation (for reference only)
Deformation degree of winding
Correlation coefficient R
Hard deformation
RLF <0.6
Obvious deformation
1.0 >RLF ≥0.6 or RMF <0.6
Slight deformation
2.0 >RLF ≥1.0 or 0.6 ≤ RMF <1.0
Normal winding
RLF ≥ 2.0 and RMF ≥1.0 andRH F ≥0.6
Note: RLF is the correlation coefficient of the curve in the low frequency band
(1kHz~100kHz);
RMF is the correlation coefficient of the curve in the middle frequency band
(100kHz~600kHz);
RHF is the correlation coefficient of the curve in the high frequency range
(600kHz~1000kHz).
Table of contents
Other Huazheng Measuring Instrument manuals

Huazheng
Huazheng HZSF-801 User manual

Huazheng
Huazheng HZ-8700 User manual

Huazheng
Huazheng HPC500 User manual

Huazheng
Huazheng PHS-2F User manual

Huazheng
Huazheng HZDZ-S3 User manual

Huazheng
Huazheng HZSF-641 User manual

Huazheng
Huazheng HZ1434 User manual

Huazheng
Huazheng HZCT-100B User manual

Huazheng
Huazheng HZX52AA User manual

Huazheng
Huazheng HZ2831 User manual