KMB SML 133 Series How to use

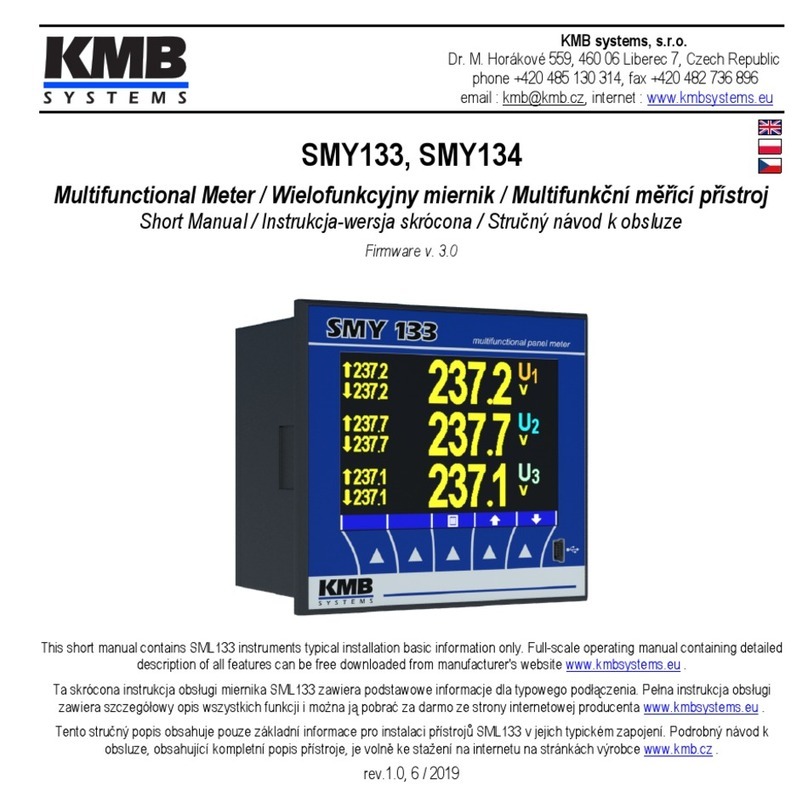
SML133
Multifunctional Meter / Wielofunkcyjny miernik / Multifunkční měřící přístroj
Short Manual / Instrukcja-wersja skrócona / Stručný návod k obsluze
Firmware v 3 0
This short manual contains SML133 instruments typical installation basic information only. Full-scale operating manual containing detailed
description of all features can be free downloaded from manufacturer's website www. mbsystems.eu .
Ta s rócona instru cja obsługi mierni a SML133 zawiera podstawowe informacje dla typowego podłączenia. Pełna instru cja obsługi
zawiera szczegółowy opis wszyst ich fun cji i można ją pobrać za darmo ze strony internetowej producenta www. mbsystems.eu .
Tento stručný popis obsahuje pouze zá ladní informace pro instalaci přístrojů SML133 v jejich typic ém zapojení. Podrobný návod
obsluze, obsahující ompletní popis přístroje, je volně e stažení na internetu na strán ách výrobce www. mb. cz .
rev.1.0, 6 / 2019
KMB systems, s.r.o.
Dr. M. Horá ové 559, 460 06 Liberec 7, Czech Republic
phone +420 485 130 314, fax +420 482 736 896
email : mb@ mb.cz, internet : www. mbsystems.eu

1. Instrument Connection
1.1 Physical
The SML 133 instrument is built in a plastic box to be installed in a distribution board panel. The instrument’s position must be
fixed with loc s.
Natural air circulation should be provided inside the distribution board cabinet, and in the instrument’s neighbourhood,
especially underneath the instrument, no other instrumentation that is source of heat should be installed or the temperature
value measured may be false.
1.2 Power Supply
The supply voltage (in range according technical specifications) connects to terminals AV1 (No. 9) and AV2 (10) via a
disconnecting device (switch – see wiring diagram). It must be located at the instrument’s proximity and easily accessible by
the operator. The disconnecting device must be mar ed as such. A two-pole circuit brea er with the C-type tripping
characteristics rated at 1A ma es a suitable disconnecting device, its function and wor ing positions, however, must be
clearly mar ed. A connection cable maximum cross section area is 2.5 mm2.
In case of DC supply voltage the polarity of connection is generally free, but for maximum electromagnetic compatibility the
grounded pole should be connected to the terminal AV2.
1.3 Measured oltages
The phase voltages measured are connected to terminals U1 (12), U2 (13), U3 (14), the common terminal to connect to the
neutral wire is identified as N (11; it stays free at delta- (3D) and Aron- (3A) connections). It is suitable to protect the voltage
lines measured for example with 1A fuses. Measured voltages can also be connected via instrument voltage transformers.
A connection cable maximum cross section area is 2.5 mm2.
1.4 Measured Currents
The instruments are designed for indirect current measurement via external CTs only. Proper current signal polarity (S1, S2
terminals) must be observed. You can chec the polarity by the sign of phase active powers on the instrument display (in
case of energy transfer direction is nown, of course).
The current signals from 5A or 1A (or 0.1A for the „X/100mA“ models) instrument current transformers must be connected to
the terminal pairs I11, I12, I21, I22, I31, I32 (No. 1 ÷ 6). In the P.01 parameter (see below), set the CT-ratio.
The I2 terminals stay free in case of the Aron connection.
A connection cable maximum cross section area is 2.5 mm2.

2. Basic Operation
On connecting power supply the display shows all of the segments, then gradually screens with the instrument type and
setting of basic parameters
1. line 1 : 1 3 3 - instrument type number
line 2 : 5 A - current input type
line 3 : r I- digital output type : relay (r), solid-state (I), or none (n)
2. when connection of voltage via voltage transformers set (otherwise the screen is s ipped) :
line 1 : U t - voltage transformer connected identification
line 2 : nominal primary voltage [ V]
line 3 : nominal secondary voltage [ V]
3. line 1 : C t - current transformer/range specification
line 2 : nominal primary current [A]
line 3 : nominal secondary current [A]
4. line 1 : F U - nominal frequency and voltage
line 2 : nominal frequency
line 3 : nominal voltage
Then the instrument starts display actual measured values. Simultaneously, if the instrument has a communication line, it can
be set and its measured values read via the communication lin using a PC.
2.1 Setup
At this moment it is necessary to set instrument parameters that are essential for proper instrument measurement :
•CT ratio – parameter 01 (and its multiplier, optionally)
•type of connection – parameter 02 (wye, delta, Aron)
•mode of connection – parameter 04 (direct or via VT connection, VT ratio and multiplier, optionally)
•nominal frequency fNOM and nominal voltage UNOM – double parameter 05
Usually, it is only necessary to adjust the CT ratio. Next example shows how to do it :
Assuming that the ratio of used CTs is 750/1 A. First off all, it is necessary to switch display from measured data branch (the
ULN screen on the example below) to the parameter branch with the button. The branch is indicated with the symbol
. Parameter 01 appears – this parameter is the CT ratio and its default value is 5/5 A.

Now enter editing mode by pressing and holding the until the value gets flashing.
As soon as the value flashes, release the . Now you can change it. Increase primary value by pressing of the . If you
eep it pressed two-speed autorepeat helps to reach target value quic ly. Then use multiple pressing of the and for
fine setup.
To change the secondary value, simply press the . The button serves as toggle switch between 5 and 1.
CT Ratio Change Procedure Example
Target CT value is prepared now and we can leave the edit mode with (short) pressing the . The value is stored into the
instrument memory and the flashing stops.
Now return to so called main parameter branch (see below) with next pressing the and then you can scroll to other
parameters with and and edit them in a similar way or you can return to the measured data branch with the .
The summary of all instrument parameters is stated in the table below. Their description is stated in following chapters.
long
multi
ple

2.2 Measured Data
The instrument starts display actual measured values on power-up. The screen that was selected before the last powerdown
is displayed. You can navigate through all of measured and evaluated values with , and buttons as shown on
the Measured Data Navigation Chart below.
If phase values displayed, individual L1 / L2 / L3 - phase value is shown in the line 1 / 2 / 3. If a three-phase value is
displayed, it is shown in the line 2 and the Σ symbol appears.
Most of data are arranged in four columns :
•Actual …. actual values, refreshed each 3 measurement cycles (30/36 mains cycles)
•Avg …...... average values per appropriate averaging period (see below)
•AvgMax ... maximum of the avg-value reached since the last clearing
•AvgMin …. minimum of the avg-value reached since the last clearing
You can scroll inside a column down and up with the and eys and move horizontally from a column to the next right
one cyclically with the ey.
Exception : Only actual values of harmonics and electrical energy are available. These values are arranged in different way –
see further below.
2.3 Average alues
Average values are processed according set averaging method and length of averaging window (individually for “U/I”-group
and “P/Q/S”-group of quantities). Maximum and minimum values of them are registered into the instrument's memory. The
maximums are displayed in the “AvgMax” column and they are identified with the ▲symbol in the front of the value.
Analogically, the minimums in the “AvgMin” column are identified with the ▼symbol.
Neither maximum nor minimum of cosφ values are evaluated due to special character of the quantity Similarly,
these extreme values are not evaluated at harmonics
You can clear the “AvgMax”/“AvgMin” values. All of the maximums/minimums of appropriate quantity group are cleared
simultaneously. To do it, follow next :
•navigate on corresponding AvgMax or AvgMin value
•press the ey until the value starts flashing
• with the or ey, choose the C L r option
•then confirm by pressing the

The appropriate group ( U/I or P/Q/S ) of average maxs/mins is affected by single clearing only ! Each group
must be cleared individually
If the instrument is locked, the clearing is not possible
2.4 Full Spectrum alues P/Q/PF & Fundamental Harmonic alues
Pfh / Qfh / cos φ
As standard, active and reactive powers (and therefore power factor) are evaluated from full spectrum of harmonic
components of both voltage and current.
Sometimes (for example for power factor compensation system chec ing), it is useful to now fundamental harmonic part of
these quantities too. Such quantities are mar ed Pfh, Qfh, cos φ.
As you can see on the navigation chart you can navigate from the full spectrum values branch with the ey further right
into the fundamental harmonic values branch and vice versa. To distinguish actual displayed branch, the H symbol is
displayed for the fundamental harmonic branch.
Exception : Actual values only of fundamental harmonic power factor – the cos φ – are evaluated (no average values
available). Next, this fundamental harmonic power factor can be expressed not only as cos φ, but as tan φ or φ too,
depending on setting of parameter 09.
2.5 Fundamental Harmonic Power Factor Formats cosφ / tanφ / φ
The fundamental harmonic power factor can be expressed not only as cos φ, but as tan φ or φ too, depending on setting of
parameter 09.
For outright specification of the quadrant, the power factor of the fundamental harmonic component is accompanied with two
attributes :
•a sign ( + or - ), which indicates polarity of appropriate active power
•a symbol or , which indicates the power factor character
At the following figures there are examples of three-phase fundamental power factor presentations :
Fundamental Harmonic Power Factor Formats

•the left figure : Σcos φ = 0.98 inductive (cho e symbol displayed). Furthermore, active three phase
power is being negative, therefore the leading “minus”-sign ( and the symbol displayed )
•the middle figure : Σtan φ = 0.20 inductive. Active three phase power is positive.
•the right figure : Σφ = 8 degrees inductive. Active three phase power is positive.
On the figure on the left, there is phase cos φ values example :
•cos φ1 = 0.97 inductive. L1-phase active power is currently negative (because
of leading “minus”-sign)
•cos φ2 = 0.94 inductive ( L2-phase active power currently positive )
•cos φ3 = 0.99 capacitive ( L3-phase active power currently positive )
2.6 THDs and Harmonic Components
You can chec actual values of both voltage and current THDs and harmonic components in appropriate rows (see the
Measured Data Navigation Chart ).
When you scroll to one of this rows, THD values of all measured phases are displayed as default. Symbols THD - - LN or
THD - A indicate phase voltage or current THD values, respectively.
With the ey you can switch to harmonic components. The symbol H appears, indicating harmonic components (of
voltage or current). Symbol % means that the values are expressed in percent of fundamental harmonic component. Order of
harmonics just displayed flashes periodically in the display middle line – for example, string H03 means 3rd harmonics.
By repetitive pressing of the ey you can chec other harmonics. Although the instrument evaluates all of the harmonic
components up to 40th order internally, only odd components to 25th order can be viewed of its display (full spectrum od the
harmonics is available via communication interface only).
2.7 Electricity Meter
Electricity meter comprises three-phase energy data and maximum tree-phase active power demand value. The values are
situated in particular row.
Depending on the parameter 08 setup, two electricity meter display modes can be chosen :
•“4E+MD” mode (default)
•“8E” mode

2.7.1 “4E+MD” Display Mode
In this mode, first four windows contain three-phase energies of four-quadrants :
•ΣEP+ … three-phase imported active energy, indicated with Σ - kWh (or MWh or kMWh = GWh)
•ΣEP- … three-phase exported active energy, indicated with Σ - kWh and preceeding ― sign
•ΣEQL … three-phase inductive reactive energy, indicated with Σ - k Arh – L
•ΣEQC … three-phase capacitive reactive energy, indicated with Σ - k Arh – C
Each value occupies all of three display lines, 8 digits before the decimal point and one after it.
For the exaple at left, ΣEP+ = 293745.8 Wh.
The values are registered since the last clearing. To clear the energies, display any of them
and then follow the same procedure as for max/min average values. All of the energies are
cleared simultaneously ant start to count from zero again.
In the 5th window there is
•ΣMD … maximum of three-phase average active power (power demand), indicated with Σ - kW - ▲and bar
over the value
The value contains maximum of three-phase average active power since the last clearing. Averaging method and averaging
period for this value can be set regardless of the method of standard average values, described above.
Similarly as the energies, the value can be cleared independently.
If the instrument is locked, clearing is not possible
If the instrument is equipped with a communication interface, the values can be cleared remotely
2.7.2 “8E” Display Mode
In this mode, reactive energies registered separately depending on actual three-phase active power (ΣP) sign are displayed
(“six-quadrant ” mode; such format can be convenient for renewable sources monitoring, for example) :
•ΣEP+ … three-phase imported active energy, indicated with Σ - kWh (or MWh or kMWh = GWh)
•ΣEP- … three-phase exported active energy, indicated with Σ - kWh and preceeding ― sign
•ΣEQL+ … three-phase inductive reactive energy registered during the ΣEP value was positive (import);
indicated with Σ - k Arh – L
•ΣEQL- … three-phase inductive reactive energy registered during the ΣEP value was negative (export);
indicated with Σ - k Arh – L and preceeding ― sign
•ΣEQC+ … three-phase capacitive reactive energy registered during the ΣEP value was positive; indicated
with Σ - k Arh – C

•ΣEQC- … three-phase capacitive reactive energy registered during the ΣEP value was negative;
indicated with Σ - k Arh – C and preceeding ― sign
Furthermore, energies in VAh are available too :
•ΣES+ … three-phase apparent energy registered during the ΣEP value was positive; indicated with Σ - k Ah
•ΣES- … three-phase apparent energy registered during the ΣEP value was negative; indicated with Σ - k Ah
and preceeding ― sign
The three-phase active power demand ΣMD is not displayed in this mode.
2.8 Instrument State Symbols
Except of measured data, the instrument indicates following states with dedicated symbols :
• …........ Export of three-phase active power. Displayed when the ΣP value is negative.
• / … A1(top) and A2 (bottom) alarm lights off / on. See output setup below.
• …......... DI1 digital input state is active.
• …......... Instrument parameters are displayed.
2.9 Instrument Parameters
For proper operation in particular conditions, the instrument must be set. The instrument setup is determined using
parameters, for example the current transformer [CT] conversion, type of measured voltage connection (direct connection or
via a voltage transformer [VT] and its ratio), and connection configuration (wye / delta / Aron). Overview of all the parameters
is listed in the table below.
To chec or edit the parameters, press the ey. As default, parameter group 01 is displayed and
symbol (wrench) indicates, that setup data are displayed now.
The parameters are arranged in groups, numbered from 00 up. The number of group is displayed in the
first line in format - P. n n (with preceding dash). You can browse through the parameter groups with
the and eys.
If one parameter only in the group, its value is in the bottom line as shown at the example (nominal
power 400 VA).
If two parameters in the group, usually the first of them is displayed in the 2nd line and the second in the 3rd line ( nominal
frequency 50 Hz and nominal voltage 230 V).

To edit a particular parameter, scroll to its group. Then press and hold the until the value gets flashing. Now release
the ey and set target value with the and or the ey for some of parameters. You can use autorepeat function by
eeping one of the arrow eys pressed too. Finally, press the and the value is stored into the memory.
If more parameters in the group, the first one is chosen when entering editing mode for the first time. If you want to modify the
second parameter only, simply cancel editing of the first parameter without any change and reenter the editing again – now
the second parameter is chosen.
To return bac to measured values display, simply press the ey.
2.9.1 Main and Side Branch
For better orientation, some of parameters (parameter group No. 01, 04, 15) are placed in so called side branches. To enter
into a side branch, push . The dash in the front of the parameter number s ips down to the second row indicating the side
branch position.
Now you can list through parameters of chosen group of parameters only with the and eys. Usually, there is name
or mar of a parameter in the second line and the parameter value in the third line.
To return bac into the main branch push the .
1.2.10 Instrument Setup Locking / Unlocking
When shipped, parameter editing is unloc ed, that means :
Main and Side Branch Navigation
side branch
listing
return into
main branch
enter into
side branch
main branch
indicator side branch
indicator
next side branch
parameter
parameter
name (mar )

•all of the parameters can be edited
•standard average maximums / minimums, electricity meter energies ΣEP+, ΣEP-, etc., and electricity meter
maximum power demand ΣMD can be cleared
After being put in operation, such operations can be loc ed (=disabled) to protect the instrument against unauthorized
changes. Then operator can only chec measured values and parameters, but cannot change anything, excluding special
parameter No. 00, that serves as the instrument loc . It has one of two values :
L O C ....... instrument is loc ed
O p n ....... instrument is unloc ed (open)
If the instrument is loc ed, you can unloc it using the following procedure, which is similar to editing of other parameters:
1. Press the ey and scroll to parameter group 00 with arrow eys – value L O C is displayed.
2. Press the and hold it down until the value is replaced with flashing number between 0 0 0 and 9 9 9. As
an example, you can imagine flashing 3 4 5 is displayed.
3. Press the following sequence: , , , . The value changes gradually to 3 4 4, 3 4 5, 3 4 6,
3 4 5, so the same value is shown at the end as at the beginning.
4. Press the . The flashing number is replaced with O P n, indicating unloc ed state.
The digit shown while entering the unloc ing eypress sequence is random and it is not important for correct unloc ing (it is
there only to confuse). Only the sequence of eys pressed is important and must be followed exactly.
The instrument can be loc ed in a way analogous to unloc ing but it is necessary to press any eypress sequence that is
different from the unloc ing sequence noted above.
2.11 Display Contrast
Although the display contrast is temperature compensated, there can be sometimes necessary to tune it slightly. Press eys
and simultaneously and eep pressed. Then message C O n appears in the first line and the contrast value in the
second one. Now, if the display too light, eep the pressed and increase with repetitive pressing of the ey.
Li ewise, if too dar , eep the and adjust with the ey. Finally, release the eys and new contrast is set.
2.12 Digital Outputs & Input
Instruments can be optionally equipped with a combination of outputs and inputs.
Following inputs & outputs are available :
● digital relay output (electromechanical), mar ed as ROx (x =output number)
● digital solid state output (semiconductor), DOx
A2
A1 DI1

● digital input (semiconductor), DIx
Furthermore, all of instrument models feature two “alarm ” lights A1 and A2 for indication of various states, that can be
considered as other special digital outputs. Function of these lights can be set in the same way as at standard digital outputs.
The behaviour of digital outputs can be programmed according to requirements as :
•transmitting electricity meter pulse output mode
•standard output mode , e.g. as a simple two-position controller or a defined status indicator
The digital input DI1 state is indicated with the symbol and can be used for state monitoring via a communication lin .
2.12.1 Outputs & Input Connection
Digital inputs & outputs are connected to terminals on a rear panel of an instrument according to the following table.
Connection of Digital Outputs & Input
pin No. signal
15, 16 O1A, O1B … digital output DO1/RO1
17, 18 O2A, O2B … digital output DO2/RO2
19, 20 I1A, I1B ….... digital input DI1
All of digital outputs and input are isolated not only from instrument internal circuits but mutually too. Connected signals
magnitude must correspond with the I/O technical specifications. The signal polarity is free.
A connection cable maximum cross section area is 2.5 mm2.
2.12.2 Outputs Setup
The DO1/2 (RO1/2) output function can be chec ed in parameter group 11. Possible setup options are :
•- - - ... the output DO1/2 (RO1/2) is disabled
•- 0 - ... the output DO1/2 (RO1/2) is set to standard output mode (detailed setup available using the
ENVIS program via a communication line only)
•n n n ... the output DO1/2 (RO1/2) is set to impulse output mode with nnn pulses per Wh; the control
quantity is ΣEP+ (no symbol shown). Other control quantities options according accompanying symbol :
• - … ΣEP-
• … ΣEQL
• … ΣEQC

Example :
Output DO1 (RO1) : set to standard output mode (details via communication lin only)
Output DO2 (RO2) : set to pulse mode, 20 pulses/ Wh of energy ΣEP-
The standard output function can be used at instruments equipped with communication lin only – it can be adjusted only via
connected PC using ENVIS program ( see ENVIS program manual ). The pulse output function can be set simply from the
instrument panel too.
The alarm lights A1, A2 setup is not displayed, it is available via a communication line only. You can only chec if the setup is
the same as corresponding DO1/2 (RO1/2) setup or not. If any of signal lights A1, A2 is set, the outlines of both lights appear
on the display. They stay hidden when function of both lights is disabled.
2.12.3 Pulse Output Mode
Any of digital outputs or alarm lights can be set as transmitting electricity meter. The frequency of generated impulses can be
set depending on values of measured electric energy by the embedded electricity meter unit.
You can set to impulse output mode not only the DO-type (solid-state) outputs, but the RO-type (electromechanical
relay) outputs too But note lifetime of electromechanical relays, they have limited number of switchings
The outputs DO1/2 (RO1/2) can be set to impulse output mode both manually from the instrument panel and remotely via a
communication line. The manual setup is available in parameter group 11. After entering editation, set edited parameter
(range 0.001÷999) with arrow eys and select desired energy with the ey.
Example :
Output DO1 (RO1) : 0.1 pulses/ Wh = 1 pulse / 10 Wh, energy ΣEP+ (no additional symbol)
Output DO2 (RO2) : 5 pulses/ varh , energy ΣEQL (due to symbol )
By setting any of the DO1/2 (RO1/2) outputs from the instrument panel, corresponding alarm light A1/A2 is set in the
same way automatically too Then the DO1/2 (RO1/2) activity can be checked by the A1/A2 lights on the instrument
display Separate setup of the lights is available using the ENVIS program via a communication line only If any of
lights is set different from corresponding DO1/2 (RO1/2) output the symbol ▲ preceeding appropriate setup
appears
Even if an instrument is equipped with neither any digital output nor any communication line, you can set impulse
function of alarm lights A1, A2 by setting the DO1/2 (RO1/2) outputs

After the impulse function mode is set, every 200 milliseconds the instrument executes evaluation of the measured
electric energy. If the increment of recorded electric power is higher or equal to the quantity of power per one impulse,
the instrument will transmit one or two impulses. The mentioned description shows that the fluency of impulse transmission is
+/- 200 ms.
The impulse duty cycle is 50/50 ms (compliant with so-called SO-output definition), maximum frequency is 10 impulses per
second.
2.13 Communication Interface
Monitoring the currently measured values and the instrument setup can using a remote computer connected to the instrument
via a communication lin . Such operation allows you to use all the setup options of the instrument, which it is not possible from
the panel of the instrument.
Following chapters describe instrument communication lin s from the hardware point of view only. The detailed description of
ENVIS program can be found in the program manual.
2.13.1 RS-485 Interface (COM)
The lin is isolated from other circuits of the instrument. Use terminals A+ (No. 28/31), B- (29/32) and G (30/33) – the
alternative numbering is valid for models with two communication interfaces. If both of them are of the RS-485 type, the
second lin (COM2) is mar ed A+2 (No. 31), B-2 (32) and G2 (33).
Both of the lin s are insulated both from the instrument internal circuitry and mutually too, terminals No. 30 and 33 are not
connected internally !
Standard setup for this interface is address 1, communication rate 9600 Bd and 8 bits protocol.
2.13.2 Ethernet Interface (ETH)
Using this interface the instruments can be connected directly to the local computer networ (LAN). Instruments with this
interface are equipped with a corresponding connector RJ- 45 with eight signals (in accordance with ISO 8877), a physical
layer corresponds to 100 BASE- T.
Each instrument must have a different IP- address, preset during the installation. The address can be set from the instrument
panel or you can use the ENVIS-DAQ program. For detection of actual IP-address you can use the Locator function.
2.13.3 M-Bus Interface (M-BUS)
The interface is insulated from other instrument circuitry. Used signals are : M+ (No. 28), M- (29).
Standard setup for this interface is address 1, communication rate 2400 Bd and 9 bits with even parity protocol. Secondary
address is BCD-coded instrument serial number.

1. Podłączenie urządzenia
1.1 Informacje ogólne
Mierni i SML133 zabudowane są w obudowie z tworzywa sztucznego i przystosowane do montażu w panelu rozdzielni.
Pozycja umieszczenia urządzenia musi być zgodna z uchwytami zabezpieczającymi.
Wewnątrz obudowy rozdzielnicy musi być zachowany naturalny obieg powietrza, a w sąsiedztwie mierni a nie może
znajdować się inne urządzenie będące źródłem ciepła, ponieważ zmierzona przez mierni wartość temperatury może być
obarczona dużym błędem.
1.2 Zasilanie pomocnicze
Napięcie zasilania (o reślone według specyfi acji technicznej) podłącza się do zacis ów AV1 (9) i AV2 (10). Obwód zasilania
należy zabezpieczyć urządzeniem wyłączającym (patrz schemat). Musi ono być usytuowane w sąsiedztwie instrumentu i
łatwo dostępne dla operatora. Urządzenie ta ie musi być wyraźnie oznaczone. Bezpieczni o prądzie nominalnym 1A jest
odpowiedni do spełnienia fun cji urządzenia wyłączającego, jego fun cje i pozycje działania muszą być wyraźnie oznaczone.
Ma symalny prze rój przewodów do podłączenia wynosi 2,5mm2.
1.3 Pomiar napięcia
Poszczególne fazy napięcia pomiarowego są podłączone do zacis ów U1 (12), U2 (13), U3 (14), zacis do podłączenia
przewodu neutralnego jest o reślony ja o N (11) i pozostaje nie podłączony w u ładach pomiarowych trój ąt (3D) i Arona
(3A). Obwody napięcia pomiarowego należy zabezpieczyć np. bezpieczni ami o prądzie znamionowym 1A. Napięcia
pomiarowe można również podłączyć poprzez prze ładni i napięciowe.
Ma symalny prze rój przewodów do podłączenia wynosi 2,5mm2.
1.4 Pomiar prądu
Mierni i są przeznaczone do pośredniego pomiaru prądu, tyl o poprzez zewnętrzne prze ładni i prądowe CT. Należy
przestrzegać właściwej polaryzacji sygnału prądowego (zacis i S1, S2). Można sprawdzić polaryzację przez wyświetlany
zna przy pomiarze fazowych mocy czynnych (oczywiście w przypad u znanego ierun u przepływu energii).
Sygnały prądowe 5A, 1A czy 0,1A (dla wersji X/100mA) z prze ładni ów prądowych muszą być odpowiednio podłączone do
zacis ów I11 (1), I12 (2), I21 (3), I22 (4), I31 (5), I32 (6). W parametrze P.01 (patrz poniżej) należy ustawić prze ładnię
prze ładni ów CT.
W przypad u podłączenia w u ładzie Arona zacis i I21 i I22 pozostają nie podłączone.
Ma symalny prze rój przewodów do podłączenia wynosi 2,5mm2.

2. Podstawowe operacje
Po podłączeniu napięcia zasilającego wyświetlacz po azuje wszyst ie segmenty, następnie stopniowo e rany z typem
urządzenia oraz ustawienia podstawowych parametrów.
1. linia 1: 1 3 3 - typ urządzenia
linia 2: 5 A - rodzaj wejścia prądowego
linia 3: r I- typ wyjścia: prze aźni owe (r), impulsowe (I), bra (n)
2. w przypad u podłączenia napięcia poprzez prze ładni i napięciowe nastawy (jeśli bra e ran jest pomijany):
linia 1: U t - identyfi acja podłączonego prze ładni a napięciowego
linia 2: nominalne napięcie pierwotne ( V)
linia 3: nominalne napięcie wtórne ( V)
3. linia 1: C t - identyfi acja podłączonego prze ładni a prądowego
linia 2: nominalny prąd pierwotny (A)
linia 3: nominalny prąd wtórny (A)
4. linia 1: F U - nominalna częstotliwość i napięcie
linia 2: nominalna częstotliwość
linia 3: nominalne napięcie
Następnie rozpoczyna się wyświetlanie wartości mierzonych. Jednocześnie, jeśli urządzenie posiada wyjście omuni acyjne
i jest ono zaprogramowane, wartości parametrów mierzonych można odczytać poprzez wyjście omuni acyjne na
omputerze PC.
2.1 Programowanie
W tym momencie onieczne jest ustawienie parametrów mierni a, tóre są niezbędne do prawidłowego pomiaru parametrów:
•CT prze ładnia – parametr P01
•Typ podłączenia – parametr P02 (gwiazda, trój ąt, Arona),
•Tryb podłączenia – parametr P04 (bezpośrednie, poprzez prze ładni i napięciowe VT, prze ładnia)
•Nominalna częstotliwość fNOM i nominalne napięcie UNOM – parametr P05.
Zazwyczaj onieczne jest jedynie, aby ustawić wartość prze ładni a CT. Poniższy przy ład po azuje ja to zrobić:
Przy założeniu, że stosune używanych prze ładni ów CT jest 750/1. Po pierwsze, onieczne jest przełączenie wyświetlacza
z gałęzi mierzonych parametrów (z e ranu ULN, ja na przy ładzie poniżej) do gałęzi parametrów przycis iem . Gałąź ta

oznaczona jest symbolem lucza . Pojawia się parametr P01 – ten parametr jest wartością prze ładni a CT, i
domyślnie jest ustawiona na 5/5A.
Teraz aby przejść do tryb edycji, należy nacisnąć i przytrzymać przycis , aż wartość zacznie migać. Następnie zwolnić
.
Teraz możemy modyfi ować wartość pierwotną prze ładni a, aby ją zwię szyć naciśnij , jeśli przytrzymamy przycis
zwię szymy szyb ość zmiany parametru. Następnie używając przycis ów lub ustawiamy żądaną wartość.
Aby zmienić wartość wtórną prze ładni a wystarczy nacisnąć przycis , służy on do zmiany wartości z 5 na 1.
Przykładowa procedura zmiany wartości przekładnika CT
Docelowa wartość prze ładni a prądowego CT jest ustawiona i teraz możemy wyjść z trybu edycji rót o nacis ając przycis
. Wartość ta jest przechowywana w pamięci instrumentu.
Teraz można przejść do innych parametrów nacis ając lub i edytować je w podobny sposób, lub powrócić do
mierzonych parametrów używając przycis u .
Podsumowanie wszyst ich parametrów podano w tabeli poniżej . Ich opis zawarto w olejnych rozdziałach.
przytr
zymać
kilka
razy

2.2 Dane pomiarowe
Urządzenie rozpoczyna wyświetlanie mierzonych wartości od e ranu tóry był wybrany ja o ostatni przed wyłączeniem.
Można poruszać się po wszyst ich mierzonych i ocenianych wartościach używając przycis ów , i , ja
po azano poniżej w rozdziale Nawigacja po danych pomiarowych.
Jeśli wyświetlane są wartości fazowe dla poszczególnych faz L1 / L2 / L3 to wartość dla fazy po azana jest odpowiednio w
wierszach 1/ 2/ 3. Jeśli jest wyświetlana wartość trójfazowa, to jest ona po azana w wierszu 2 i pojawia się symbol Σ.
Wię szość danych jest usytuowana w czterech olumnach:
•Actual wartości rzeczywiste są odświeżane co 3 cy le pomiarowe,
•Avg wartości średnie w ustawionym czasie uśredniania (patrz poniżej),
•AvgMax wartość średnia ma simum osiągnięta od ostatniego asowania,
•AvgMin wartość średnia minimum osiągnięta od ostatniego asowania.
Możesz przewijać wewnątrz wybranej olumny w dół i w górę używając przycis ów , i poruszać się poziomo z
olumny do następnej w prawo (cy licznie) używając przycis u .
Wyjąte : tyl o dostępne wartości rzeczywiste harmonicznych i energii są rozmieszczone w inny sposób – patrz poniżej.
2.3 Wartości średnie
Wartości średnie są przetwarzane zgodnie z ustawioną metodą uśredniania i wiel ością o na uśredniania (indywidualnie dla
grupy „U/I” i dla grupy „P/Q/S”). Ma symalne i minimalne wartości średnie są rejestrowane w pamięci instrumentu. Ma sima
są wyświetlane w olumnie „AvgMax” i identyfi owane symbolem „ ▲” przed wartością, analogicznie minima, w olumnie
„AvgMin” i są identyfi owane z symbolem „▼” przed wartością.
Wartości maksymalne i minimalne dla parametru cosφ nie są określane, podobnie te skrajne wartości nie są
oceniane dla harmonicznych
Możesz wyczyścić wartości „AvgMax”/ „AvgMin”. Wszyst ie ma sima i minima z odpowiedniej grupy są usuwane
jednocześnie.
Aby to zrobić, wy onuj olejno:
•Przejdź do odpowiednich wartości „AvgMax” lub „AvgMin”
•Naciśnij przycis aż zacznie migać wartość
•Przycis iem lub wybierz opcję C L r
•Potwierdź nacis ając przycis

Wyszukaną odpowiednią grupę (U/I lub P/Q/S) średnich maksimum lub średnich minimum można kasować
pojedynczo
Każda grupa musi być kasowana indywidualnie Jeśli urządzenie jest zablokowane, opcja kasowania jest
niemożliwa
2.4 Pełne spektrum wartości P/Q/PF i podstawowa harmoniczna
wartości Pfh/Qfh/cosφ
Standardowo moce czynne i bierne (a więc i współczynni mocy) oceniane są z pełnego spe trum harmonicznych zarówno
napięcia ja i prądu.
Czasami (na przy ład dla sprawdzenia u ładu ompensacji), dobrze jest widzieć też podstawową harmoniczną tych
wiel ości. Ta ie wartości są oznaczane Pfh, Qfh, cosφ.
Ja widać powyżej w o nie nawigacji można poruszać się z pełnego spe trum danego parametru i dalej w prawo do
podstawowej harmonicznej tego parametru i na odwrót używając przycis u . Aby odróżnić te wartości, symbol H jest
wyświetlany dla wartości podstawowej harmonicznej parametru.
Wyjąte : Tyl o rzeczywiste wartości dla podstawowej harmonicznej współczynni a mocy – czyli cosφ - są oceniane (nie są
dostępne wartości średnie). Dodat owo ta wartość podstawowej harmonicznej współczynni a mocy może być wyrażona nie
tyl o ja o cosφ, ale ta że ja o tgφ, lub ąt φ, w zależności od ustawienia parametru P09.
2.5 Format podstawowej harmonicznej współczynnika mocy cosφ /
tgφ / φ
Wartość podstawowej harmonicznej współczynni a mocy może być wyrażona nie tyl o ja o cosφ, ale ta że ja o tgφ, lub ąt
φ, w zależności od ustawienia parametru P09. Dla pomiaru cztero wadrantowego, współczynni owi mocy dla s ładowej
podstawowej harmonicznej towarzyszą dwa atrybuty:
•Zna (+ lub -), tóry ws azuje na ierune przepływu mocy czynnej,
•Symbol ( lub ), tóry ws azuje na chara ter współczynni a mocy.
Na poniższych rysun ach są prezentowane przy łady trójfazowej podstawowej harmonicznej współczynni a mocy:
Formaty podstawowej harmonicznej współczynnika mocy

•Lewy rysune : Σcos φ = 0,98 indu cyjny (symbol dławi a wyświetlany). Ponadto trójfazowa moc
czynna jest ujemna, dlatego wartość poprzedzona jest zna iem minus (a ta że symbol jest
wyświetlany)
•Rysune w środ u: Σtan φ = 0,20 indu cyjny. Moc czynna trójfazowa jest dodatnia
•Prawy rysune : Σφ = 8 stopni indu cyjny. Moc czynna trójfazowa jest dodatnia.
Na rysun u z lewej strony, przy ład z cos φ w ażdej fazie:
•cos φ 1= 0,97 indu cyjny, moc czynna fazy L1 obecnie ujemna (ponieważ
wyświetlany zna minus)
•cos φ 2 = 0,94 indu cyjny, moc czynna fazy L2 obecnie dodatnia
•cos φ3 = 0,99 pojemnościowy, moc czynna fazy L3 obecnie dodatnia
2.6 THD i składowe harmoniczne
Możesz sprawdzić rzeczywiste wartości THD dla obu parametrów, napięcia i prądu oraz s ładowe harmoniczne w
odpowiednich rzędach (patrz Nawigacja po gałęzi danych pomiarowych).
Po przejściu do jednego z rzędów, wartości THD wszyst ich mierzonych faz są wyświetlane domyślnie. Symbole THD - -
LN lub THD - A ws azują odpowiednio na THD napięcia fazowego lub THD prądu.
Z przycis iem można przełączyć się na s ładowe harmoniczne. Pojawienie się symbolu H, ws azuje s ładowe
harmoniczne (napięcia lub prądu). Symbol %, oznacza, że wartości są wyrażone w procentach podstawowej harmonicznej.
Numer harmonicznej cy licznie pulsuje na środ owej linii wyświetlacza – na przy ład ciąg zna ów H03 oznacza 3-cią
harmoniczną.
Poprzez olejne nacis anie przycis u możemy sprawdzić olejne harmoniczne. Mimo, że mierni ocenia wszyst ie
s ładowe harmoniczne do 40 rzędu, to tyl o te s ładowe nieparzyste do 25 rzędu można zobaczyć na wyświetlaczu (pełne
spe trum harmonicznych jest dostępne tyl o na PC za pośrednictwem interfejsu omuni acyjnego).
2.7 Licznik energii
Liczni energii ele trycznej obejmuje dane energii trójfazowej i ma symalną wartość trójfazowej mocy czynnej. W zależności
od ustawień parametru P08, możemy wybrać dwa tryby wyświetlania energii ele trycznej.
•Tryb „4E+MD” (domyślny)
•Tryb „8E”
2.7.1. Tryb wyświetlania „4E+MD”
W tym trybie, pierwsze cztery o na zawierają energię trójfazową w czterech ćwiart ach:
Other manuals for SML 133 Series
2
Table of contents
Languages:
Other KMB Measuring Instrument manuals
Popular Measuring Instrument manuals by other brands

Hanna Instruments
Hanna Instruments HI 96734C instruction manual

SIGRIST
SIGRIST TurBiScat PM 40 Brief instructions

SIGRIST
SIGRIST TurBiScat 2 Ex Brief instructions

Levenhuk
Levenhuk Ermenrich Reel GD60 user manual

THORLABS
THORLABS CS20K2 Operation manual

PCB Piezotronics
PCB Piezotronics 3711F1110G Installation and operating manual