This Quick Guide provides you with the basic information you need to get the
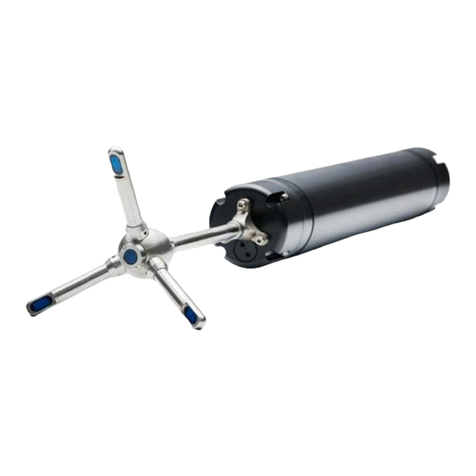
Vectrino Profiler up and running as quickly as possible. The sensor is an
extremely powerful tool for flow measurement. It is a seemingly simple system but
requires consideration of many different parameters to produce the highest quality
data. The biggest key to its successful use if an understanding of the basic
concepts of its operation and the potential problems that can occur. Experience
with the system is an important factor as well, and the value of test deployments
cannot be overemphasized. We encourage you to consult the Vectrino Profiler
User guide (available within the software) to get a more profound knowledge
covering both the sensor- and software capabilities. You will also find lots of useful
information at the Nortek web: www.nortekgroup.com
Preparation
Install the software located on the USB memory stick. The Vectrino Profiler
acquisition software requires Java virtual machine (JVM) to operate (download
from www.java.com if not prompted by the software).
Using the enclosed cables, plug in the AC adapter, and connect the Vectrino
Profiler cable and USB converter to the USB port on your computer. At high
sampling rates (above 60 Hz), the driver parameters need to be tuned to
provide an adequate display rate for the application software. Without this
tuning, higher sampling rates will result in a sporadic display update. Please
refer to the SW User Guide, in the software (click Help) for more information.
Start the Vectrino Profiler software.
Click Communication > Connect >Vectrino
Select the appropriate serial port and port speed (baud rate) and press Apply.
It is recommended to use a baud rate of 937500 for optimized performance.
You may take this opportunity to provide a specific “Instrument Name” for your
device. This may help differentiate instruments if you have several in the same
experiment.
Run a Probe check in accordance with the procedure described in the Vectrino
Profiler User Guide to verify that the instrument is working as expected.
Test the measurement quality with the Probe Check function: Open
Configuration; tick the Probe Check and Start Data Collection. Make sure
the instrument is submerged in water during this test.
Configuration
Click the Configuration button to activate the dialog for configuring the
instrument velocity settings, bottom check settings and disk file parameters. A
description of each submenu and each parameter can be found in the SW User
Guide. Extra attention should be given to the Velocity range parameter. Read
more about Weak Spots below.
When the parameters are adjusted, press Apply and/or OK and accept the
changes.
By using the Open/Save commands in the File menu the configuration
parameters can be saved to a *.nts file at any given time and reloaded when it
is time to deploy the instrument.
Getting Started
Data can be displayed by clicking the Start Collecting Data button.
After data collection has started, the button switches to Stop Collecting Data.
The button switches back to Start mode when the instrument has been verified
to complete collecting data.
The display window shows profiling and time series graphs for data currently
being collected. A status display is shown on the upper right of the panel. This
shows four lights used to display status information while collecting data (run
status, collection status, connection status, and instrument status). Hovering
the mouse over each status light will display more detailed information.
Save to Disk can be enabled either before data collection is started or during
data collection. The preferred mode is enabling before starting collection.
