PASCO PASPORT PS-2174 User manual

®
Instruction Sheet
012-09911D
Weather/Anemometer Sensor
PS-2174
Quick Start
1. Connect the Weather/Anemometer Sensor to your PASPORT
interface.
2. If you are using a computer, connect the PASPORT interface
to it and start DataStudio.
3. Shield the sensor from direct sunlight.
4. Hold the sensor so that so that air flows into the rear of the
windmill.
5. Press or click the start button to begin recording data.
Introduction
The Weather/Anemometer Sensor measures
• wind speed,
• air temperature,
• relative humidity, and
• barometric pressure.
From these primary measurements it calculates
• wind gust speed
• dew point
• humidex
• wind chill, and
• absolute humidity.
The sensor connects to a PASPORT interface. If it is a logging
interface (such as Xplorer or Xplorer GLX) in standalone mode,
data are recorded and displayed on the interface itself. If the PAS-
PORT interface is connected to a computer, data are recorded and
displayed on the computer in DataStudio.
Set-up
Connect Sensor to Interface
Plug the sensor into any port of your PASPORT interface, either
directly or using the PASPORT extension cable (PS-2500).
Sensor Positioning
• Optional: Screw a 1/4-20 threaded rod (such as CI-9874) or
tripod into the mounting hole on the back of the sensor and
mount it as illustrated (Figure 1).
• Hold (or mount) the sensor vertically so that air flows into
the rear of the windmill (Figure 1).
• Shield the sensor from direct sunlight.
Windmill
Anemometer
Humidity
Transducer
Temperature
Transducer
Included Equipment Part Number
Weather/Anemometer Sensor PS-2174
PASPORT Extension Cable PS-2500
Additional Equipment Required
PASPORT Interface See page 4
Replacement Parts
Replacement Impeller PS-9879
Weather/Anemometer Sensor
PS-2174

®
Weather/Anemometer Sensor PS-2174
2
Figure 1: Mounting options and air flow direction
Interface and Software
Configuration (Optional)
The interface or software automatically prepares itself for data
recording when you connect the sensor. Follow the steps below to
change the default settings.
GLX Configuration (Standalone Mode)
To Add Measurements to the Digits Screen
In the Digits screen, press G, H, or I to display more measure-
ments.
To Change the Displayed Measurement
In any display screen, press c twice to open the data source menu,
from which you can select a measurement for display.
To Change Measurement Units
1. In any display screen, press c to light up the active fields.
2. Use the arrow keys to highlight the measurement unit.
3. Press c to open the units menu, from which you can select a
different unit.
To Change the Sampling Rate
1. Open the Sensors screen by pressing h + I.
2. Press c to open the Sample Rate Unit menu. For rates faster
than once per second, select samples/s. For slower rates,
Select seconds, minutes, or hours.
3. Press d to highlight Sample Rate.
4. Press + or - to change the rate or time between samples.
DataStudio Configuration
To Create a New Data Display
1. Double-click the Graph, Digits, or other display icon in the
Summary bar. A list of data sources appears.
2. Select the measurement that you want to display and click
OK.
To Change Measurement Units
1. Click Setup to open the Experiment Setup window.
2. Under the first or second Measurements tab, click the unit of
measure that you want to change. A menu opens.
3. Click the desired unit.
To change the sampling rate
1. Click Setup to open the Experiment Setup window.
2. Click the units next to the sample rate setting. A menu opens.
For rates faster than once per second, select Hz. For slower
rates, Select seconds, minutes, or hours.
3. Click the arrow buttons next to the Sample Rate setting to
change the rate or time between samples.
Data Collection
GLX (standalone mode)
To Display Data without Recording
Open the Digits or Meters screen. The GLX displays live data.
To Record Data
1. Press s. The GLX starts recording data.
2. Press s again to stop recording.
3. Press s again to start recording in a new data run.
DataStudio
To Display Data without Recording
1. Open the Experiment menu and select Monitor. DataStudio
displays live data.
Mounting Hole
Air Flow
Air Flow

®
Weather/Anemometer Sensor PS-2174
3
2. Click Stop to stop monitoring data.
To Record Data
1. Click Start. DataStudio starts recording data.
2. Click Stop to stop recording.
3. Click Start again to start recording in a new data run.
Measurement Tips
Equilibration Time After a rapid change in temperature or
humidity, the sensor may take several seconds to come to equilib-
rium with the environment. Observe the measurements and wait
for them to stabilize.
Alignment with Wind Hold the sensor so that wind blows
straight into the back of the windmill.
Shade The sensor, especially the temperature and humidity
transducers, must be out of direct sunlight to make accurate mea-
surements.
Moisture Protect the sensor from liquid water. The sensor
must be dry and free of condensation to make accurate measure-
ments.
About the Measurements
Primary Measurements
The four primary measurements are determined from the sensor's
wind, temperature, humidity, and pressure transducers.
Wind Speed The sensor determines Wind Speed from the rate
of rotation of the windmill. It assumes that air is flowing straight
into the back of the windmill. Wind speed must be at least 0.5 m/s
to be measured accurately. Wind speed is measured in units of
m/s, km/h, mph (miles per hour), knots, and ft/s (feet per second).
Air Temperature Temperature is measured by the thermistor
temperature transducer. To work accurately, the transducer must
be in shade. Temperature is measured on the Celsius and Fahren-
heit scales.
Relative Humidity Relative humidity is measured by the
humidity transducer. To work accurately, the transducer must be
in shade and at air temperature. Relative humidity is reported as a
percentage representing the ratio of the partial pressure of water
vapor to the saturated vapor pressure.
Barometric Pressure Barometric Pressure is measured by a
pressure transducer inside the unit. The reported Barometric
Pressure is the actual air pressure, not sea-level corrected pres-
sure. Barometric Pressure is measured in units of mbar, hPa, and
inHg (inches of mercury).
Secondary Measurements
Each secondary measurement is a calculation based on one or
more of the primary measurements.
Wind Gust Speed Wind Gust is the maximum speed
detected since the previous sample. For instance, if the sampling
period is 1 minute, each Wind Gust value is the maximum speed
that occurred in the previous minute. At the default sampling rate
of 5 samples/s, Wind Gust Speed does not differ much from
Wind Speed; however, at slower sampling rates, the difference
may be significant. Wind Gust is measured in units of m/s, km/h,
mph, knots, and ft/s.
For the Wind Gust measurement to be valid, the sensor must
remained powered between samples. If your logging interface is
allowed to “sleep” between samples, wind gusts may not be cap-
tured.
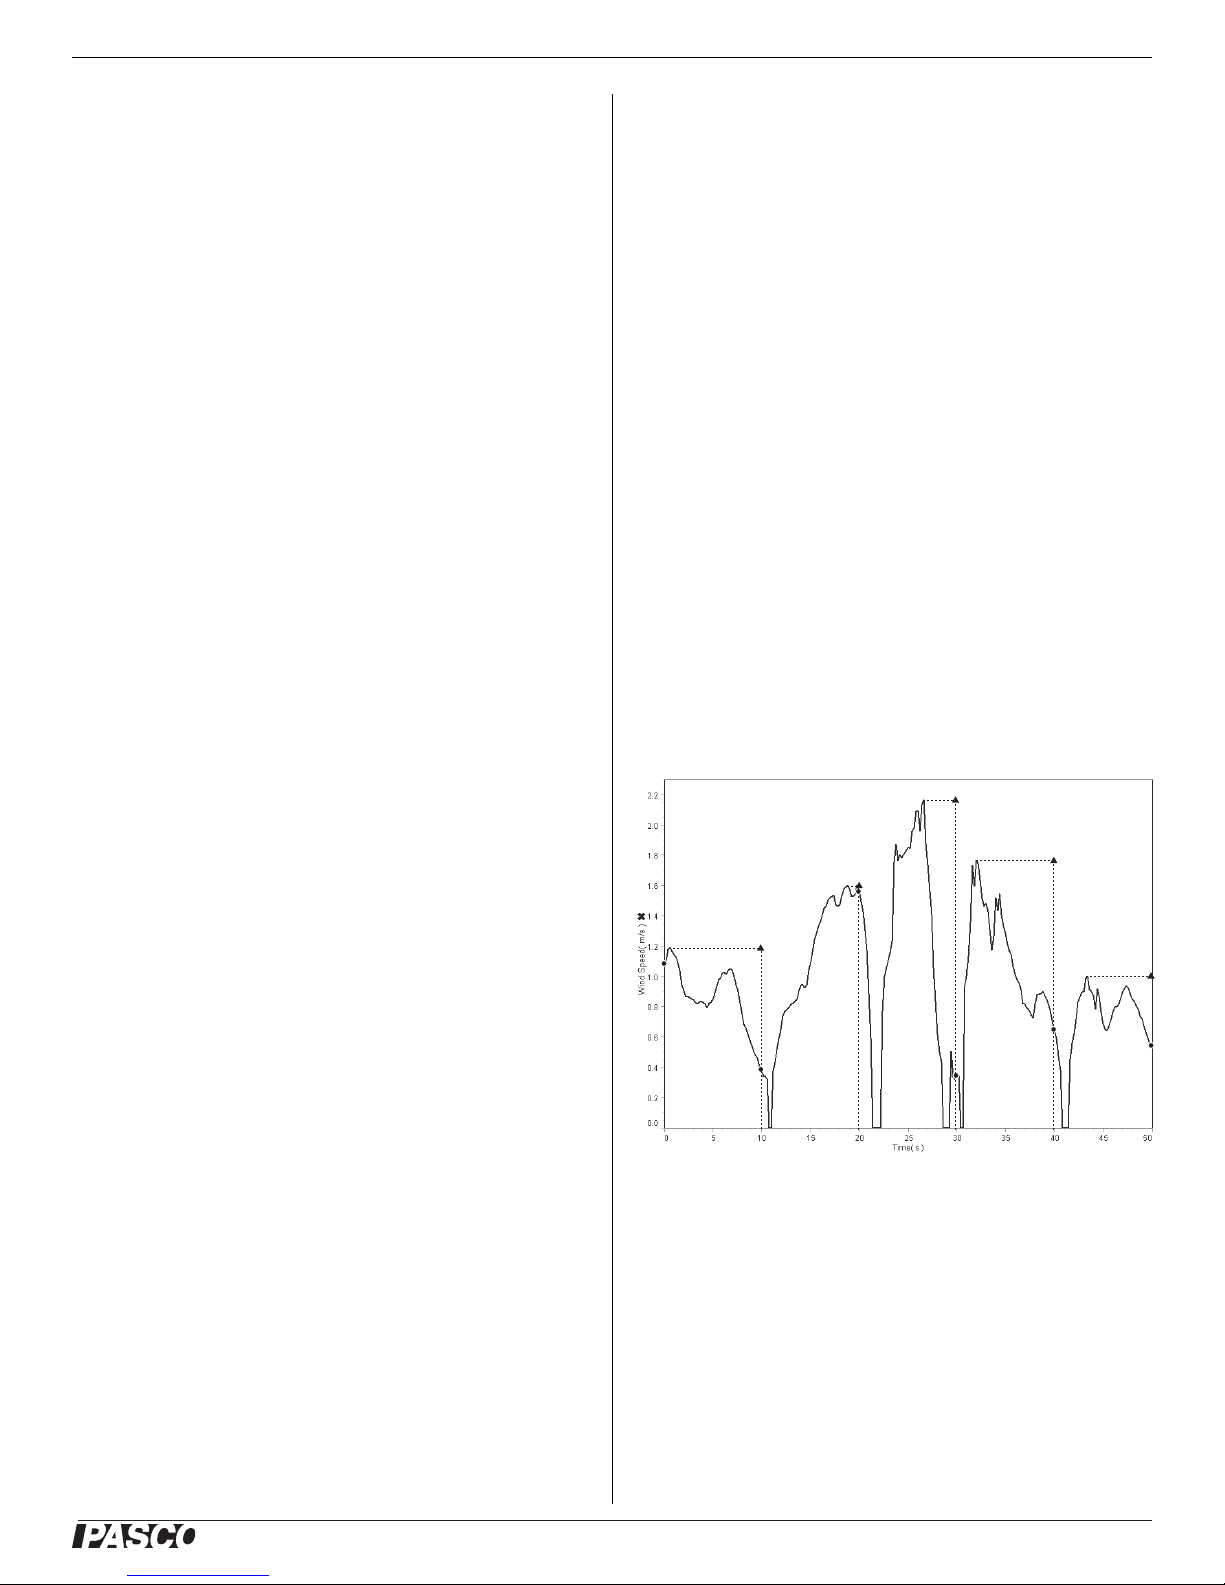
The graph (Figure 2) shows wind speed recorded at 5 samples/s.
The circles represent what the measured data would have been if
the sampling rate had been set to 1 sample every 10 s. The trian-
gles show what the wind gust data would have been at that sam-
pling rate.
Figure 2: Wind Speed (circles) and Wind Gust (triangles)
Dew Point Dew Point is the temperature to which air must be
cooled at constant pressure for water vapor to condense. Dew
Point is reported as a temperature on the Celsius and Fahrenheit
scales. The sensor calculates Dew Point (in °C) with the formula:
Dew Point
430.22–237.7 SatVP RH
100
-----------------------------
ln+
SatVP RH
100
-----------------------------
ln–19.08+
----------------------------------------------------------------------------------------=

®
Weather/Anemometer Sensor PS-2174
4
where is the saturation
water vapor pressure, RH is Relative Humidity (as a percentage),
and Tis Temperature in °C.
Absolute Humidity Absolute Humidity is a measure of the
mass of water vapor present in a given volume. It is reported in
units of g/m3. The sensor calculates Absolute Humidity with the
formula:
Where RH is Relative Humidity (as a percentage), and Tis Tem-
perature in °C.
Wind Chill Wind Chill indicates a combined effect of temper-
ature and wind speed. It is reported as an apparent temperature on
the Celsius and Fahrenheit scales. The sensor calculates Wind
Chill (in °F) using the formula:
where Tis air temperature (in °F) and Vis wind speed (in miles
per hour).
Wind Chill is defined for temperatures at or below 50° F and
wind speed above 3 miles per hour; outside of those limits, the
sensor reports a value equal to Air Temperature.
Humidex Humidex indicates a combined effect of temperature
and humidity. It is reported as an apparent temperature on the
Celsius and Fahrenheit scales. The sensor calculates Humidex (in
°F) using the formula:
where Tit temperature in °C, and eis the water vapor pressure in
mbar.
Sea-level Corrected Pressure
A typical weather station does not report the actual measured
barometric pressure. Rather, it reports a “sea-level corrected”
value. Use this formula to calculate the sea-level corrected pres-
sure (in mbar):
[Barometric Pressure (mbar)]+1013*(1-exp(-h/7000))
where his the sensor’s elevation in m. To have this calculation
done automatically, enter it in the DataStudio calculator or GLX
Calculator screen.
Specifications
Compatible Interfaces
The Weather/Anemometer Sensor is compatible with all wired
PASPORT interfaces and loggers including USB Link (PS-2100),
Xplorer (PS-2000), PowerLink (PS-2001), and Xplorer GLX
(PS-2002).
For wireless use, the Weather/Anemometer Sensor is compatible
with AirLink SI model PS-2005A. It is not compatible with
model PS-2005.
Technical Support
For assistance with any PASCO product, contact PASCO at:
Limited Warranty For a description of the product warranty, see the
PASCO catalog.
Copyright The PASCO scientific 012-09911D Weather/Anemometer
Sensor Instruction Sheet is copyrighted with all rights reserved. Permis-
sion is granted to non-profit educational institutions for reproduction of any
part of this manual, providing the reproductions are used only in their labo-
ratories and classrooms, and are not sold for profit. Reproduction under
any other circumstances, without the written consent of PASCO scientific,
is prohibited.
Trademarks PASCO, PASCO scientific, DataStudio, ScienceWorkshop,
Xplorer and Xplorer GLX are trademarks or registered trademarks of
PASCO scientific, in the United States and/or in other countries. All other
brands, products, or service names are or may be trademarks or service
marks of, and are used to identify, products or services of, their respective
owners. For more information visit www.pasco.com/legal.
SatVP 6.11 7.75 T237.7 T+
10=
Absolute Humidity 13.24 RH
T273.15+
----------------------------17.42T
T239.7+
-----------------------
exp=
Wind Chill (°F) 35.74 0.6215T35.75V0.16
–0.4275T0.16
++=
Humidex T5
9
---e10–+=
Measurement Range Resolution Accuracy
(% of reading)
Wind Speed 0.5 to 29 m/s 0.1 m/s ±(3% of reading
+ 0.2 m/s)
Temperature -20 to 55 °C 0.1 °C ±0.5 °C
Relative
Humidity
0 to 100% 1% ±2%
Barometric
Pressure
150 to 1150 hPa 0.03 hPa 1 hPa
Address: PASCO scientific
10101 Foothills Blvd.
Roseville, CA 95747-7100
Phone: 916-786-3800 (worldwide)
800-772-8700 (U.S.)
Fax: (916) 786-7565
Web: www.pasco.com
Email: [email protected]
Table of contents
Other PASCO Measuring Instrument manuals

PASCO
PASCO ES-9078 User manual

PASCO
PASCO PASPORT PS-2204 User manual

PASCO
PASCO SF-9500A User manual

PASCO
PASCO PS-3234 User manual

PASCO
PASCO OS-8525A User manual

PASCO
PASCO PS-3237 User manual

PASCO
PASCO SF-9069 User manual

PASCO
PASCO EM-3556 User manual

PASCO
PASCO Pasport PS-2600 User manual

PASCO
PASCO OS-8458 User manual

PASCO
PASCO OS-8526A User manual

PASCO
PASCO OS-8527A User manual

PASCO
PASCO SP-9285 User manual

PASCO
PASCO PS-3215 Use and care manual

PASCO
PASCO PS-3515 User manual

PASCO
PASCO ME-9495A User manual

PASCO
PASCO PASPORT PS-2131 User manual

PASCO
PASCO SF-9568A User manual

PASCO
PASCO PASPORT PS-2108 User manual

PASCO
PASCO Pasport PS-2152 User manual