Cirs ATS570 User manual
USER GUIDE
U
L
T
R
A
S
O
U
N
D
Q
U
A
L
I
T
Y
A
S
S
U
R
A
N
C
E
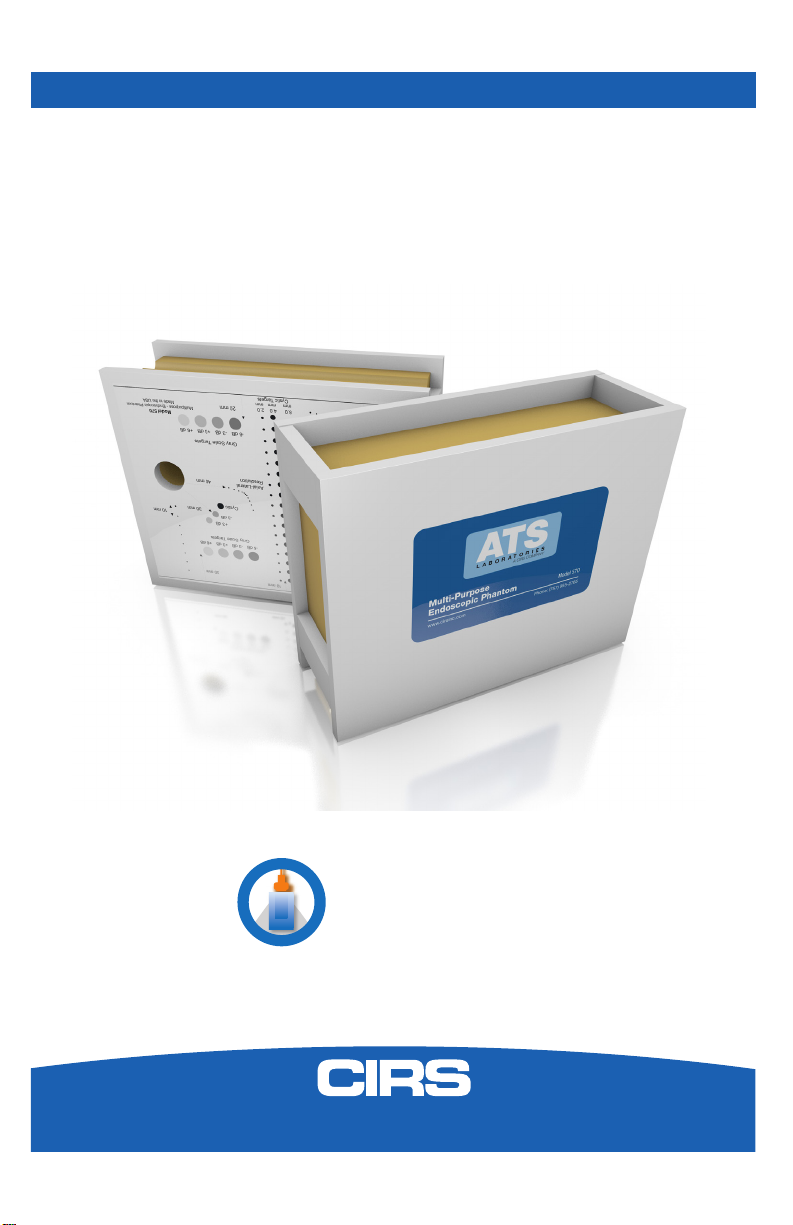
Multi-Purpose & Endoscopic
Phantom
Model ATS570
900 Asbury Ave • Norfolk, Virginia 23513 • USA • Tel: 757-855-2765 • WWW.CIRSINC.COM

TABLE OF CONTENTS
1 OVERVIEW
1
2 INSTRUCTIONS FOR USE
2
HANDLING AND CARE
��������������������������������������������������������������� 2
GENERAL GUIDELINES FOR PERFORMING MEASUREMENTS
������������������������� 2
ESTABLISHING A BASELINE
��������������������������������������������������������� 3
3 TESTING PROCEDURES
4
UNIFORMITY TESTING
��������������������������������������������������������������� 4
DEPTH OF PENETRATION
������������������������������������������������������������ 4
BEAM PROFILE/FOCAL ZONE/LATERAL RESPONSE WIDTH
��������������������������� 5
VERTICAL DISTANCE MEASUREMENT
������������������������������������������������ 6
HORIZONTAL DISTANCE MEASUREMENT
��������������������������������������������� 6
AXIAL AND LATERAL RESOLUTION
��������������������������������������������������� 7
GRAYSCALE CONTRAST SENSITIVITY
������������������������������������������������ 8
DEAD ZONE ASSESSMENT
����������������������������������������������������������� 8
4 SPECIFICATIONS
10
5 WARRANTY
13
6 APPENDIX: QUALITY ASSURANCE RECORD FOR MODEL ATS570
14

1
OVERVIEW
The Model 570 Multipurpose & Endo-
scopic phantom is an easy, compre-
hensive means of evaluating imaging
systems over the full range of clinical
imaging frequencies (2 MHz to 18
MHz). The phantom is designed with
a combination of monolament line
targets for distance measurements
and tissue mimicking target struc-
tures of varying sizes and contrasts.
Due to the acoustic similarity of the
background material and the target
structures, artifacts caused by distor-
tion, shadowing and enhancement
have been eliminated. Four gray
scale targets ranging in contrast from
+6 to -3 dB are provided to evalu-
ate the system's displayed dynamic
range and gray scale processing
performance.
The Model 570 offers a new and
improved scan surface design to
easily accommodate linear, sector,
endoscopic probes and mechani-
cal sector probes such as used for
rectal scanning.
CIRS is certified to ISO 13485:2016 standards. We have an in-house test facility to
measure acoustic properties of materials. In addition, ultrasound imaging systems
are used to inspect each phantom. Every ultrasound phantom that CIRS
distributes has passed thorough testing during manufacture and completion to
ensure the highest quality product available. A Certificate of Compliance is issued
with each phantom.
Additional guidance on establishing a quality assurance program can be found in
the accreditation programs established by the ACR and AIUM at www.acr.org or
www.aium.org.
Key Tests with Model
ATS570
• Uniformity
• Depth of Penetration
•Beam Prole/ Focal Zone/
Lateral Response Width
•Vertical Distance Measure-
ment
•Horizontal Distance Measure-
ment
•Axial and Lateral Resolution
•Contrast Resolution
•Grayscale Contrast Sensitivity
•Dead Zone Assessment
For more information on these tests, see
"Testing Procedures" starting on page 10

2
INSTRUCTIONS FOR USE
HANDLING AND CARE
For best results the phantom should be kept clean at all times and stored at room
temperature. In particular a build-up of dried coupling gel on the scan surface
should be avoided. The phantom may be cleaned with warm water using a lint free
cloth. Particularly stubborn stains and dirt may be removed with a mild household
cleaner. The use of petroleum solvents should be avoided since they may adversely
react with the rubber-based material.
GENERAL GUIDELINES FOR PERFORMING MEASUREMENTS
To evaluate the performance of diagnostic ultrasound imaging systems, the Model
ATS539 has a combination of monolament line targets and tissue-mimicking cylin-
drical targets of varying sizes and contrasts.
The following are general steps for imaging all targets:
• Some wires will appear as short lines rather than dots. When using the
electronic calipers, always take measurements from a point on one echo
to the same point on the next (i.e., center to center). Otherwise, errors may
be introduced.
• If a convex probe is used, center the target within the scan plane in order to
minimize degradation and distortion introduced on the outer edges of the
probe.
• When assessing vertical distance measurements, DO NOT press on the
scanning surface. Pressure on the scanning surface causes the wires
to become temporarily displaced, making vertical distance measure-
ments inaccurate.
• When assessing horizontal distance accuracy, ensure that the scan plane is
perpendicular to the horizontal target group. Rotation of the probe will result
in inaccurate distances.
• Always be sure the phantom is scanned while at room temperature. A
phantom just received may be colder or hotter than room temperature de-
pending on where it was stored during shipping. Temperature affects the
speed of sound and, ultimately, the perceived measurements. The phantom
should be stored at room temperature for at least 24 hours before use to
ensure its core temperature is correct.
• The most accurate measurements will be made with the phantom 22˚C ±
1˚C (70˚F–73˚F).

3
ESTABLISHING A BASELINE
Before performing routine quality assurance measurements, establish:
1. System settings for each measurement:
System setup can have a dramatic impact on the results obtained from quality as-
surance measurements. You must establish and record what system settings
should be used for each of the quality assurance tests. These same settings
should be used each time the test is performed. If not, then the conclusions
drawn may not be valid. CIRS recommends that you use the most commonly
used settings for the type of probe tested- i.e. the liver preset values for an abdominal
probe- which are called a "normal" technique in the sections that follow.
2. Baseline measurements:
The rst set of measurements taken will be the baseline measurements for the
combination of system settings and phantom. Record the system settings and
phantom serial number used to acquire each measurement along with
your measurement results. On subsequent scans, refer to the baseline results
to determine if the ultrasound system has drifted to an unacceptable level. It is
each facility's responsibility to establish the magnitude of drift allowed
before corrective action is warranted.
3. Allowable deviation from baseline measurements:
The difference between the original baseline measurements and subsequent
measurement should be calculated and recorded. At some point the difference
will be large enough that some action is required (call service, replace system,
etc.). Each facility needs to determine the action level for each test. You should
refer to the user’s manual of your ultrasound scanner and note the stated
accuracies of the system’s general imaging measurements. These stated ac-
curacies may greatly inuence the conclusion made when evaluating the ultra-
sound system. For example, if the measurement accuracy for your system
is 10% for distances up to 2 cm, the scanner may detect 2.0 cm as being any
where from 1.8 cm to 2.2 cm and still be functioning properly. The user is
responsible for establishing action levels.
4. Frequency of system assessment:
How often each system is evaluated is also up to each facility to determine.
CIRS recommends at least annually.
Reference the accreditation programs established by the ACR and AIUM at
www.acr.org or www.aium.org for further guidance on establishing a QA program.

4
TESTING PROCEDURES
The following sections outline procedures for routine quality control tests with the
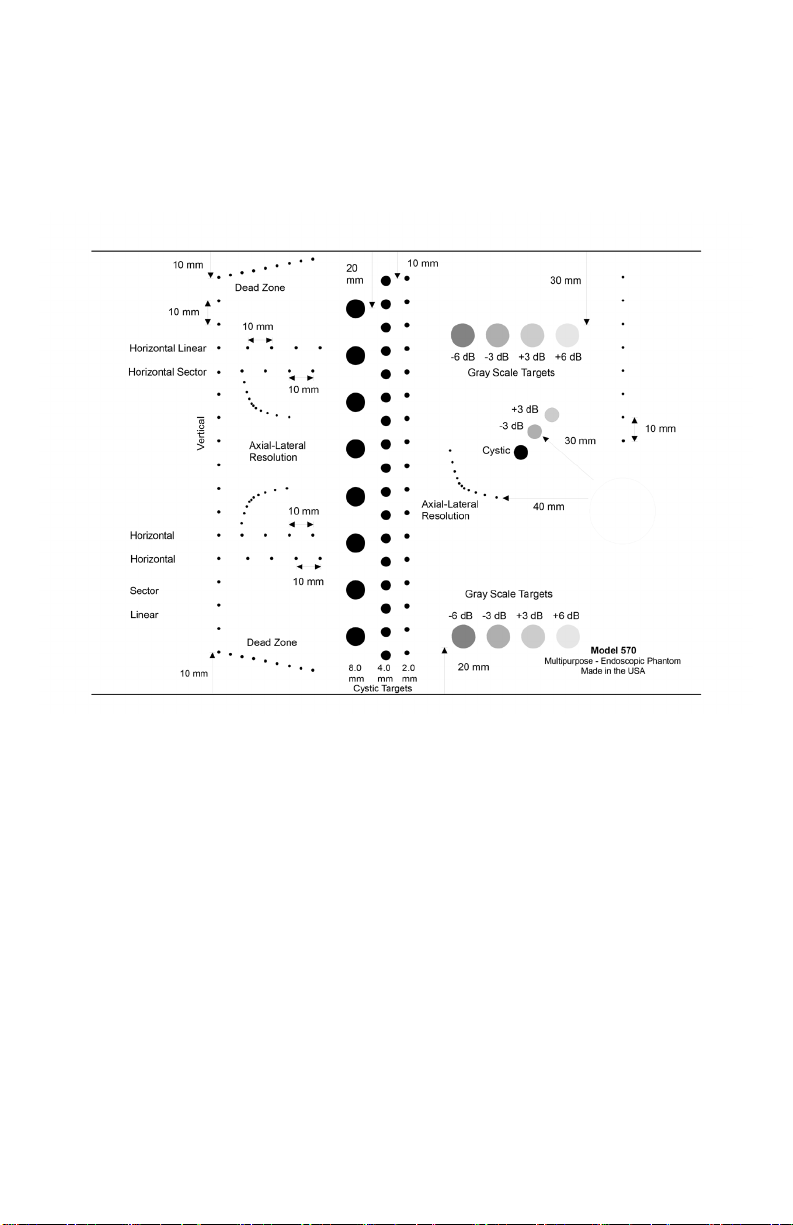
Model ATS570. It may be useful to refer to the target map, shown in the Specica-
tions section of page 15, when reviewing these procedures.
UNIFORMITY TESTING
Uniformity is dened as the ability of the machine to display echoes of the same
magnitude and depth with equal brightness on the display. This is a good test to
ensure all crystals within the transducer are functioning.
1. Apply coupling gel to the scanning surface or ll the water trough with tap water.
2. Position the transducer on the scanning surface in a region with a minimum
number of targets.
3. Adjust the instrument settings (gain, TGC, output, etc.) as for a “normal”
technique. Record these settings for use on subsequent testing.
4. Align the probe so that the targets are maximized.
5. Freeze the image and obtain a hard copy.
6. Observe the general appearance of the phantom. Note if all regions at the
same depth are displayed with the same intensity across the image.
7. Record your observations.
DEPTH OF PENETRATION TESTING
The ability of an imaging system to detect and display weak echoes from small ob-
jects located at specied depths (penetration) is referred to as sensitivity. Clinically,
weak reecting echoes are commonly produced from internal structures of organs.
Denition of these structures can be extremely important in the interpretation of the
ultrasound ndings. Sensitivity can be affected by the pulser/receiver section of the
system, the degree of focusing of the transducer, attenuation of the medium, depth
and shape (geometry) of the reecting object, and electromagnetic interference
from the local surroundings. A system’s maximum depth is limited by output power,
TGC, gain, transducer frequency, focal depth, number of scan lines and electrical
noise. Testing is performed as follows:
1. Position the transducer over the 8 mm group of anechoic targets.
2. Freeze image and obtain a hard copy.
3. Examine the image to determine the last or deepest target structure displayed.
Using the electronic calipers or the timing markers measure the depth of this
target.
4. This test should also be performed with output levels set at the highest and
lowest settings. This enables any changes in output to be more easily detected.

5
5. Document the depth measurement on the quality assurance record.
Results:
The system's depth of penetration should remain consistent from week to week
when using the same instrument settings and Model 570 phantom. Compare the
test results obtained from the baseline records. If the current image demonstrates
changes in the system's ability to resolve these targets, corrective action should be
considered.
BEAM PROFILE, FOCAL ZONE AND LATERAL RESPONSE WIDTH
The focal zone is the region surrounding the focal point in which the intensity and
the lateral resolution is the greatest. Clinically, structures examined within the focal
zone will provide the best diagnostic information obtainable. The focal zone can be
affected by changes in the pulsing/receiving section of the imaging system or dam-
age to the transducer. Testing is performed as follows:
1. Position the transducer over the vertical group of line targets on the phantom,
until a clear image is obtained. A line rather than a dot is produced on
the display. The length of the line is indicative of the width of the beam.
Therefore, targets inside the focal zone form a shorter line than those outside
of the focal zone. Adjustments in the gain settings will change the length of the
line targets displayed. Freeze the display and obtain a hard copy.
2. For a variable focused transducer, scans with several different focal zone
settings should be performed. Dynamically focused transducers may not
display changes in the width of the line targets. However a change in the
intensity can be observed upon adjustment of the transmitting focus of the
transducer.
3. Using the hard copy, draw a line connecting the ends of the echoes received
from the line targets (both sides), the line should form a smooth curve. This will
illustrate the shape of the sound beam. Now locate the narrowest portion,
this is the focal zone. Measure the width of the beam and the depth at this
point.
4. Document the depth of the focal zone and the measurement of the focal width
on the quality assurance record.
Results:
The system's focal zone should remain consistent from week to week when using
the same instrument settings and Model 570 phantom. Compare the test results
obtained from the baseline records. If the current image demonstrates changes in
the system's ability to resolve these targets, corrective action should be considered.

6
VERTICAL DISTANCE MEASUREMENTS
Vertical distance measurements are obtained along the axis of the sound beam. Ac-
curate representation of the size, depth and volume of a structure is a critical factor
in a proper diagnosis. Most imaging systems use depth markers and/or electronic
calipers to obtain these measurements. The phantom is scanned and a distance
measurement obtained using the timing markers and/or electronic calipers. The
resulting measurement is then compared to the known distance between the line
targets in the phantom. The accuracy of vertical distance measurements depends
on the integrity of the timing circuitry of the imaging system. Testing is performed as
follows:
1. Position the transducer over the vertical group of line targets until a clear image
is obtained. Freeze the display.
2. Using the electronic calipers or the timing markers measure the greatest
distance that can be clearly imaged between line targets.
3. Document the measurement obtained on the quality assurance record.
Results:
The system's vertical distances measurements should remain consistent from
week to week when using the same instrument settings and Model 570 phantom.
Compare the test results obtained from the baseline records. If the current image
demonstrates changes in the system's ability to resolve these targets, corrective
action should be considered.
HORIZONTAL DISTANCE MEASUREMENTS
Horizontal distance measurements are obtained perpendicular to the axis of the
sound beam. Proper diagnosis depends on the accurate representation of the size
and volume of a structure being examined. Most imaging systems use distance
markers and/or electronic calipers to obtain these measurements. The phantom is
scanned and a distance measurement obtained. The resulting measurement is then
compared to the known distance in the phantom. The accuracy of the horizon-
tal distance measurements depends on the integrity of the transducer scanning
assembly, the output intensity and the resolution of the imaging system. Testing is
performed as follows:
Note: The Model 570 General & Small Parts phantom provides two scanning
surfaces used to evaluate horizontal measurement calibration. Due to the geometry
and variety of sector scan transducers a separate set of horizontal line targets are
provided to evaluate lateral resolution. Please refer to the specication page for the
location of these groups.
1. Position the transducer over the horizontal group of line targets until a clear
image is obtained. Freeze the image.
2. Using the electronic calipers or the timing markers measure the greatest
distance that can be clearly imaged between line targets displayed.

7
3. Document all of the measurements on the quality assurance record.
Note: Some sector scanners have distance markers on the outside edges of the
sector image with no other indicators available. Hand-held calipers must be used
for distance measurements within the image on the monitor.
Results:
The system's horizontal distance measurements should remain consistent from
week to week when using the same instrument settings and Model 570 phantom.
Compare the test results obtained from the baseline records. If the current image
demonstrates changes in the system's ability to resolve these targets, corrective
action should be considered.
AXIAL AND LATERAL RESOLUTION TESTING
Resolution is the minimum reector separation between two closely spaced objects
which can be imaged separately along the axis of the beam, whereas lateral resolu-
tion denes the system’s ability to image objects separately that lie perpendicular
to the axis of the sound beam. If a system has poor resolution capabilities, small
structures lying close to each other will appear as one image, causing improper in-
terpretation of the ultrasound ndings. Axial Resolution depends on the transducer’s
center frequency, damping characteristics and pulse length. Generally, the higher
the frequency the better the system’s axial resolution. Lateral Resolution depends
on the beam width, focusing characteristics of the transducer, number of displayed
scan lines and the system’s sensitivity and gain settings.
The locations in the phantom are referenced from the rst axial target.
The line targets are spaced at 5.0, 4.0, 3.0, 2.0, 1.0 mm intervals both axially and
laterally. The last point of the axial array target group is also the rst target point in
the lateral array group. Testing is performed as follows:
1. Position the transducer over the axial-lateral resolution group of line targets on
the phantom until a clear image is obtained. Freeze this image.
2. Examine the image to determine if all of the line targets within the group are
clearly displayed as separate target points. Record the closest spaced target
points which can be imaged (refer to specication drawing). Obtain a hard
copy of the display.
3. Document all observations made on the quality assurance record.
Results:
The system's ability to resolve the array targets at given depths should remain con-
sistent from week to week when using the same instrument settings and Model 570
phantom. Compare the test results obtained from the baseline records. If the cur-
rent image demonstrates changes in the system's ability to resolve these targets,
corrective action should be considered.

8
GRAYSCALE CONTRAST SENSITIVITY
Gray scale or gray scale processing uses the amplitude of the echoes received to
vary the degree of brightness of the displayed image. The adjustment of the echo
signal required to go from a just noticeable (lowest gray scale level) echo to the
maximum echo brightness is referred to as the displayed dynamic range. Clinically,
gray scale processing and displayed dynamic range allow echoes of varying de-
grees of amplitude to be displayed in the same image.Testing of grayscale contrast
is performed as follows:
1. Position the transducer over the gray scale target group until a clear image is
obtained.
2. Freeze image and obtain a hard copy.
3. Examine the image. The targets should appear circular in shape, with clear
sharp edges and vary in the degree of brightness ranging from low to high
levels of contrast. The presence or absence of any shadowing behind the
structures should be noted.
4. All ndings should be documented on the quality assurance record.
Results:
This target group varies in echogenicity and provides a good indication of the per-
formance of the gray scale processing and displayed dynamic range. The system's
gray scale processing should remain consistent from week to week when using
the same instrument settings and Model 570 phantom. Compare the test results
obtained from the baseline records. If the current image demonstrates changes in
the system's ability to resolve these targets, corrective action should be considered.
DEAD ZONE ASSESSMENT
The dead zone is the distance from the front face of the transducer to the rst
identiable echo at the phantom/patient interface. The dead zone occurs because
an imaging system cannot send and receive data at the same time. Therefore, no
clinical data can be collected in this region. However if artifacts are noted within
the dead zone, they may indicate uctuations in the input power to the system.
The depth of the dead zone depends upon the frequency and performance of the
transducer and the pulsing/receiving section of the system.
The depth of the dead zone may be measured as follows:
1. Scan the phantom until the dead zone target group is clearly displayed.
Freeze this image.
2. This group is composed of 9 line targets. The rst target is positioned
2 mm below the scan surface. Subsequent targets are spaced 1
mm apart, to a depth of 10 mm.

9
3. Using the electronic calipers, measure the distance between the rst tar
get imaged and the echo produced by the scan surface. The
resulting value will be the depth of the dead zone
4. Document the depth measurement on the quality assurance record.
Results:
The system's dead zone should remain consistent from week to week when using
the same instrument settings and Model 570 phantom. Compare the test results
obtained from the baseline records. If the current image demonstrates changes in
the system's ability to resolve these targets, corrective action should be considered.
References:
BOOTE, E., FORSBERG, F., & GARRA, B. (2008). ROUTINE QUALITY ASSURANCE FOR DIAGNOSTIC ULTRASOUND EQUIPMENT. AMERICAN
INSTITUTE OF ULTRASOUND IN MEDICINE.
MICHELL M. GOODSITT, PAUL CARSON; “REAL-TIME B-MODE ULTRASOUND QUALITY CONTROL TEST PROCEDURES, REPORT OF AAPM ULTRA-
SOUND TASK GROUP NO. 1,” MEDICAL PHYSICS, 25 (8) AUGUST 1998
W. N. MCDICKEN, PHD, “DIAGNOSTIC ULTRASONICS, PRINCIPLES AND USE OF INSTRUMENTS,” JOHN WILEY & SONS, 1976.
SANDRA L. HAGEN-ANSERT; “TEXTBOOK OF DIAGNOSTIC ULTRASONOGRAPHY,” MOSBY, 1989.
10
SPECIFICATIONS
TARGET LAYOUT
PHANTOM
Housing PVC
Outer Dimensions 27 x 21.5 x 9.6cm
Scanning Surface 17.5x7.5 cm 14.0 x7.5 cm
Scanning Material Urethane Rubber
Speed of Sound 1450 m/s at 23°
WIRE TARGETS
Material Nylon monolament
Diameter 0.12mm
ENDOCAVITY
Opening: Ø 26.9mm x 71mm deep
Slots: 12.7 mm; Ø 0.5" x 10mm deep (from bottom of the
curve to the at surface)

11
VERTICAL DISTANCE GROUP
Number of targets: B1: 17
B2: 8
Depth range: B1: 10-160 mm
B2: 10-80 mm
Spacing: B1: 10 mm
B2: 10 mm
HORIZONTAL DISTANCE GROUP
Number of groups: 2
Depths: 5 & 5 cm
Number of Targets: 10
Spacing: 2 cm
DEAD ZONE GROUP
Number of targets: 9
Depth range: 2.0 - 10.0 mm
Spacing: 1 mm
AXIAL-LATERAL RESOLUTION GROUPS
Number of targets: 11
Lateral Displacement: 1 mm
Spacing: 5.0, 4.0, 3.0, 2.0, 1.0 mm
Depth: 7.0, 11.0, 4.0, 16.0 cm
CONTRAST TARGETS (CYSTS)
Type: Non-echogenic, cylindrical
Column 1: 8 mm targets, Qty 8; spaced at 2 cm intervals
Column 2: 4 mm targets, Qty 17; spaced at 1 cm intervals
Column 3: 2 mm targets, Qty 17; spaced at 1 cm intervals

12
NOTES
All dimensions without tolerances are nominal
All measurements made at 22˚C ± 1˚C
QTY COMPONENT DESCRIPTION
1Multi-Purpose & Endoscopic Phantom
-5-Year Warranty
-User Guide
-Certicate of Compliance
MODEL ATS570 INCLUDES
GRAY SCALE TARGETS
Type: Echogenic, Cylindrical
Number of Sets: 3
Set 1:
Number of Targets: 4
Contrast Levels: +6, +3, -3, -6 dB
Diameter: 10 mm
Depth from Top
Scan Surface: 30 mm
Set 2:
Number of Targets: 4
Contrast Levels: +6, +3, -3, -6 dB
Diameter: 10 mm
Depth from Bottom
Scan Surface: 20 mm
Set 3:
Number of Targets: 2
Contrast Levels: +3, -3 dB
Diameter: 6 mm
Distance from
Endocavity Opening: 30 mm

13
WARRANTY
All standard CIRS products and accessories are warranted by CIRS against defects
in material and workmanship for a period as specied below. During the warranty
period, the manufacturer will repair or, at its option, replace, at no charge, a product
containing such defect provided it is returned, transportation prepaid, to the manu-
facturer. Products repaired in warranty will be returned transportation prepaid.
There are no warranties, expressed or implied, including without limitation any im-
plied warranty of merchantability or tness, which extend beyond the description on
the face hereof. This expressed warranty excludes coverage of, and does not pro-
vide relief for, incidental or consequential damages of any kind or nature, including
but not limited to loss of use, loss of sales or inconvenience. The exclusive remedy
of the purchaser is limited to repair, recalibration, or replacement of the product at
manufacturer’s option.
This warranty does not apply if the product, as determined by the manufacturer,
is defective because of normal wear, accident, misuse, or modication.
NON-WARRANTY SERVICE
If repairs or replacement not covered by this warranty are required, a repair estimate
will be submitted for approval before proceeding with said repair or replacement.
RETURNS
If you are not satised with your purchase for any reason, please contact Customer
Service prior to returning the product. Call 800-617-1177, email [email protected],
or fax an RMA request form to 757-857-0523. CIRS staff will attempt to remedy
the issue via phone or email as soon as possible. If unable to correct the problem,
a return material authorization (RMA) number will be issued. Non-standard or “cus-
tomized” products may not be returned for refund or exchange unless such product
is deemed by CIRS not to comply with documented order specications. You must
return the product to CIRS within 30 calendar days of the issuance of the RMA. All
returns should be packed in the original cases and or packaging and must include
any accessories, manuals and documentation that shipped with the product. The
RMA number must be clearly indicated on the outside of each returned package.
CIRS recommends that you use a carrier that offers shipment tracking for all returns
and insure the full value of your package so that you are completely protected if the
shipment is lost or damaged in transit. If you choose not to use a carrier that offers
tracking or insure the product, you will be responsible for any loss or damage to the
product during shipping. CIRS will not be responsible for lost or damaged return
shipments. Return freight and insurance is to be pre-paid.
WITH RMA NUMBER, ITEMS MAY BE RETURNED TO:
CIRS
Receiving
900 Asbury Ave,
Norfolk, Virginia, 23513 USA
PRODUCT WARRANTY PERIOD
Model ATS570 - Multi-Purpose & Endoscopic Phantom 60 Months
14
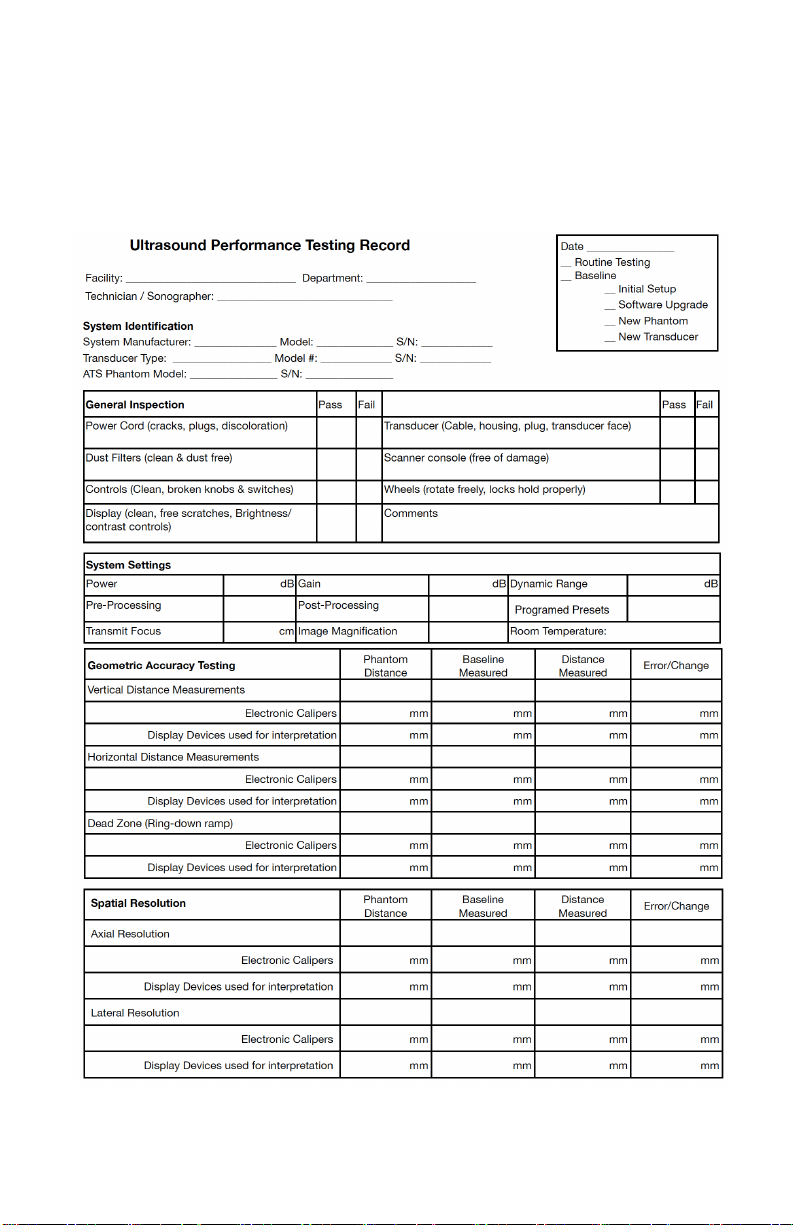
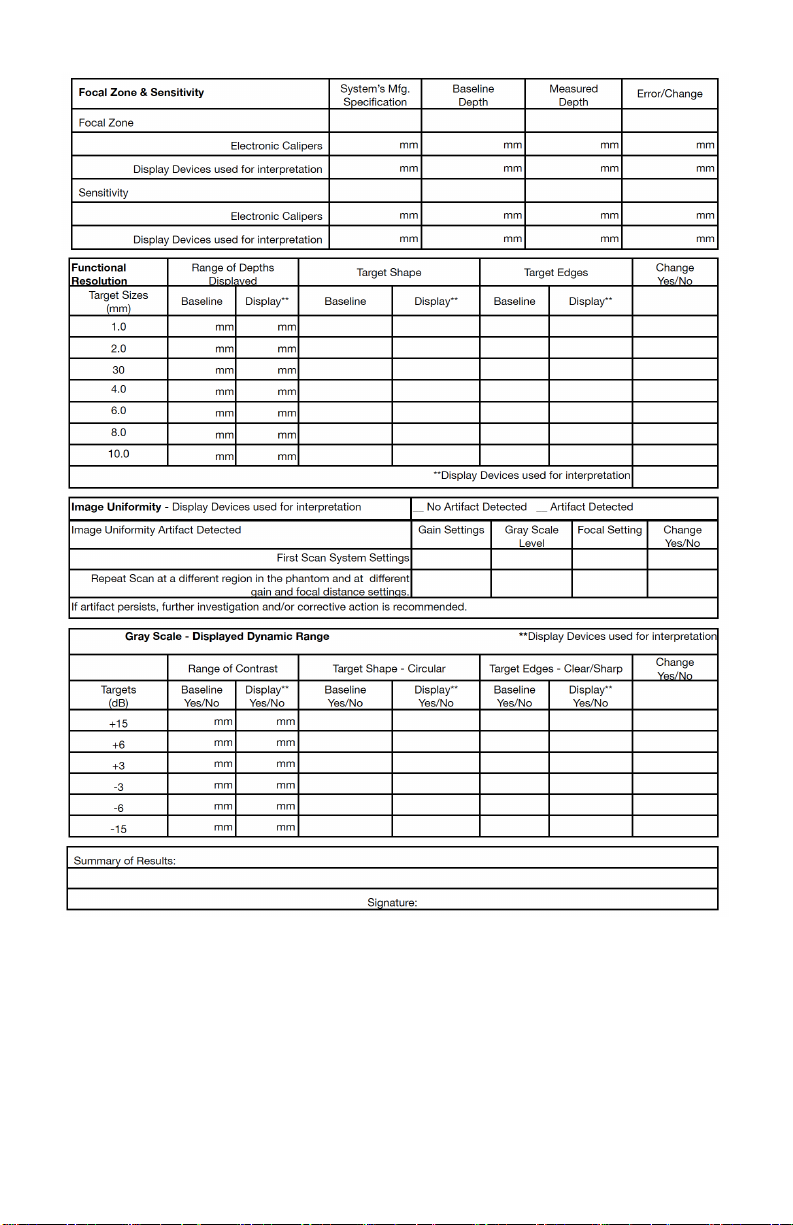
APPENDIX 1: QUALITY ASSURANCE RECORD FOR MODEL ATS570
MODEL ATS570
MULTI-PURPOSE & ENDOSCOPIC PHANTOM
QUALITY ASSURANCE RECORD
15

©2019ComputerizedImagingReferenceSystems,Inc.Allrightsreserved.
Specifications subject to change without notice.
Publication:ATS570 UG 120622
ComputerizedImagingReferenceSystems,Inc.hasbeen
certifiedby UL DQSInc.to (ISO)13485:2016.Certificate
Registration No.10000905-MP2016.
COMPUTERIZED IMAGING
REFERENCE SYSTEMS, INC.
900 Asbury Ave
Norfolk, Virginia 23513 • USA
TOLL FREE 800.617.1177
TEL: 757.855.2765
FAX: 757.857.0523
EMAIL: [email protected]
www.cirsinc.com
Technical Assistance
1.800.617.1177
Table of contents
Other Cirs Medical Equipment manuals

Cirs
Cirs 008PL User manual

Cirs
Cirs MRIdian Phantom User manual

Cirs
Cirs Brachytherapy QA Phantom User manual

Cirs
Cirs 008C User manual

Cirs
Cirs ATS 523A User manual

Cirs
Cirs ATS539 User manual

Cirs
Cirs ZERDINE 049 User manual

Cirs
Cirs 071B User manual

Cirs
Cirs Dynamic Phantoms 008A User manual

Cirs
Cirs SHANE 13650001 User manual


Popular Medical Equipment manuals by other brands


Getinge
Getinge Arjohuntleigh Nimbus 3 Professional Instructions for use

Mettler Electronics
Mettler Electronics Sonicator 730 Maintenance manual

Pressalit Care
Pressalit Care R1100 Mounting instruction

Denas MS
Denas MS DENAS-T operating manual

bort medical
bort medical ActiveColor quick guide

AccuVein
AccuVein AV400 user manual


