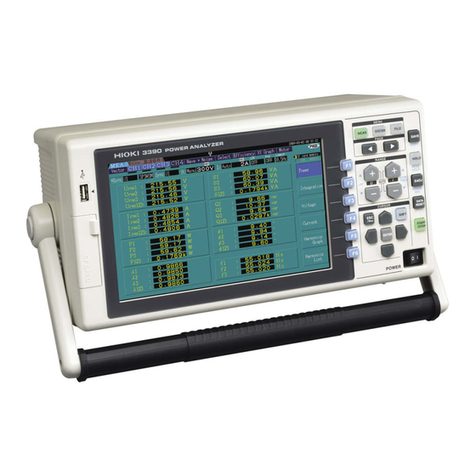
Hioki 3196 User manual

POWER QUALITY
INSTRUCTION MANUAL
3196
ANALYZER


Contents
i
Contents
Introduction.................................................................................1
Symbols......................................................................................1
Outlook of Operating Procedures...............................................2
Chapter 1
Overview___________________________________ 3
1.1 Product Overview .........................................................3
1.2 Features .......................................................................4
Chapter 2
Key Explanations and Screen Configuration _____ 9
2.1 Key Explanations .........................................................9
2.2 Screen Names and Configurations ............................11
2.2.1 Common Display Areas .................................................12
2.2.2 Screen Configurations ...................................................16
2.2.3 Screen Details ...............................................................20
Chapter 3
Connections _______________________________ 37
3.1 Connection Diagram ..................................................39
Chapter 4
Making System Settings (SYSTEM Screen) _____ 43
4.1 Using the SYSTEM Screen ........................................43
4.2 Checking the Connection ...........................................45
4.2.1 Confirming the Connection Diagram .............................45
4.2.2 Checking the Connection ..............................................47
4.3 Making System Settings .............................................49
4.3.1 Main Settings ................................................................49
4.3.2 Recording Settings ........................................................59
4.3.3 Hardware Settings .........................................................59
4.4 Event Settings Screen ................................................63
4.4.1 Measurement Settings ..................................................63
4.5 Load/Save Screen ......................................................64

Contents
ii
Chapter 5
Using Waveforms, Vectors, DMMs, and Bar Graphs
(VIEW Screen)______________________________65
5.1 Using the VIEW Screen ............................................. 65
5.2 Waveform Display ..................................................... 67
5.3 Vector Display ........................................................... 70
5.4 DMM Display ............................................................. 73
5.5 Harmonics Display ..................................................... 74
5.5.1 Harmonics Bar Graph ...................................................74
5.5.2 Harmonics List Screen ..................................................76
Chapter 6
Using the Time Series Graph (TIME PLOT Screen)79
6.1 Using the TIME PLOT Screen ................................... 79
6.2 Time Plot Settings ..................................................... 81
6.3 Changes in RMS Value ............................................. 89
6.4 Changes in Voltage ................................................... 93
6.4.1 Graphing Voltage Fluctuations for Each Interval ..........93
6.4.2 Graphing Voltage Fluctuations for Events ....................96
6.5 Changes in Harmonics ............................................ 100
6.6 Flicker ...................................................................... 104
6.6.1 IEC Flicker Meter and ΔV10 Flicker Meter ..................104
6.6.2 IEC Flicker Graph .......................................................107
6.6.3 IEC Flicker List ............................................................110
6.6.4 ΔV10 Flicker Graph .....................................................111
6.6.5 ΔV10 Flicker List .........................................................114
Chapter 7
Using Events (EVENT Screen) _______________115
7.1 Using the EVENT Screen ........................................ 116
7.2 Event Detection Method .......................................... 118
7.3 Event Settings ......................................................... 121
7.3.1 Voltage/Power Event Settings ....................................122
7.3.2 Harmonics Event Setting ............................................126
7.4 Event List Display .................................................... 127
7.5 Analyzing Event Occurrences ................................. 130
7.6 Analyzing Transient Waveforms .............................. 131
7.7 Event Monitor Display .............................................. 134

Contents
iii
Chapter 8
Using the External Control
Terminals ________________________________ 135
8.1 Connecting to the External Control Terminal ...........136
8.2 Event Input Terminal (EVENT IN) ............................137
8.3 Event Output Terminal (EVENT OUT) .....................138
Chapter 9
Loading and Saving Settings and Measured Data141
9.1 Using the Internal Memory .......................................142
9.2 Using a PC Card ......................................................143
9.2.1 Selecting a PC Card ....................................................143
9.2.2 Inserting and Removing the PC Card ..........................144

9.2.3 File Types ....................................................................145
9.2.4 Saving and Loading Files ............................................147
Chapter 10
Using a Printer ____________________________ 157
10.1 Setting the Printer ....................................................157
10.2 Printing Hard Copies ................................................158
Chapter 11
Using the PC______________________________ 159
11.1 Remote Control and Monitoring Using an RS-232C
Interface ...................................................................160
11.1.1 Connecting a Modem ..................................................161
11.1.2 Setting the 3196 ..........................................................162
11.1.3 Setting the PC .............................................................163
11.2 Control and Monitoring Using a LAN Interface .........167
11.2.1 Connecting the 3196 ...................................................168
11.2.2 Setting the 3196 ..........................................................168
11.2.3 Setting the PC .............................................................172
11.3 HTTP Server Function .............................................174
11.3.1 Overview .....................................................................174
11.3.2 Setting the HTTP Server Function ..............................175
Chapter 12
Specifications_____________________________ 179
12.1 Product Specifications ..............................................179
12.2 Measurement Specifications ....................................183
12.3 Setting Functions .....................................................194
12.4 Formulae ..................................................................199

Contents
iv
Appendix________________________________ 213
Measurement Range and Nominal Voltage........................... 213
TIME PLOT Recording Method ............................................. 215
Event Waveform Recording Method...................................... 216
Detecting Anomalies and Phenomena Due to Drops in
Power Quality ........................................................................ 217
Terminology........................................................................... 218
ΔV10 Flicker Text Time-sequence Data-header Composition226
IEC Flicker Text Time-sequence Data-header Composition. 226
Text Event Waveform Data Format Composition.................. 226
Text Voltage Fluctuation Event Data Format Composition.... 226
Text Event Data-format Composition .................................... 227
Contents of Automatic Setting of Events (thresholds)........... 228
Event Recording Sequence (Priority Order).......................... 230
Block Diagram (Analog)......................................................... 231
Block Diagram (Digital).......................................................... 232

Introduction
1
Introduction
• The 3196 Quick Start Manual accompanies this device.
Refer to this guide for precautions, information about connecting peripheral
devices, connection methods, and measurement methods.
• The present Instruction Manual mainly deals with how to make screen set-
tings and how to set peripheral devices.
• A clamp-on sensor (optional) is required to measure electrical currents with
this device.
For more details, refer to the Instruction Manual of the clamp-on sensor
that you are using.
• For detailed information on the EN50160, see the Instruction Manual for
EN50160.
• The Models 9624, 9624-10 and 9624-50 are afterwards referred to as the
“PQA-HiVIEW series”.
Symbols
Indicates that incorrect operation presents a possibility of
injury to the user or damage to the product.
Indicates advice about product performance and opera-
tions.
❖Indicates references.
Indicates quick references for operations and trouble-
shooting remedies.
*Indicates that the explanation of a technical term is at the
bottom of the page.
Indicates the explanation of a technical term.

Outlook of Operating Procedures
2
Outlook of Operating Procedures
Indicates operation keys.
Indicatesthescreen name
selected with the DF key. Indicates the name of an item displayed
on the screen.
Displays the item selected in the drop-down
list box accompanied by an explanation.
Indicates the purpose
of the settings.

1.1 Product Overview
3
The 3196 POWER QUALITY ANALYZER detects power line anomali-
ties and analyzes power line quality.
The type and time of occurrence of anomalies can be instantly deter-
mined through a variety of interfaces (RS-232C, LAN, printer and
modem).
Overview Chapter 1
1.1 Product Overview
Correctly analyze abnormal phenomena
Analysis can be performed by correlating measurement items with par-
ticular standard characteristics to ascertain the causes of power line
anomalies.
Continuous long-term monitoring and recording
Power line anomalies often occur intermittently, so they must be cap-
tured when an anomaly occurs, along with its type and intensity.
Remote control
Need for power supply
quality analysis
Electric power liberalization
Power electronics application devices
Large arc heaters, large rectifiers
Cooperative system with independent
power
Alternative energy (solar, wind pow-
er, gas turbine, etc.)
3196
3196
3196 3196
Ethernet
Public circuit
Modem
Modem
PC

1.2 Features
4
1. High speed voltage quality parameter
Transient overvoltage (impulse)
2. RMS voltage quality parameters
Voltage swell (surge), voltage dip (sag), voltage interruption
3. Power quality parameters
Frequency, voltage, current, active power, apparent power, reactive
power, power factor (displacement power factor)
4. 3-Phase quality parameters
Voltage unbalance factor, current unbalance factor
5. Harmonic quality parameters
Harmonic voltage, current and power; inter-harmonic voltage and
current; harmonic voltage and current phase angle; total harmonic
voltage and current distortion factors (THD-F, THD-R); total inter-
harmonic voltage and current distortion factors (THD-F, THD-R)
6. Other parameters
K factor, flicker
1.2 Features
Safe design
Designed to comply with safety standard EN61010-1:2001.
Supports a variety of power lines
Measures single-phase 2-wire, single-phase 3-wire, three-phase 3-
wire and three-phase 4-wire systems.
An extra input channel is provided for uses such as measuring power
lines of a second system, for direct voltage measurement or for mea-
suring a neutral line.
Simultaneous measurement of multiple elements of
power supply quality
Multiple power supply quality parameters can be selected as desired
for simultaneous measurement.
High-speed impulse detection and waveform display
function
Four voltage channels are sampled at 2 MS/s, so high-speed detection
and waveform display can be performed at up to 0.5 µs and high volt-
age (2000 Vpk transient overvoltage (impulse)).

1.2 Features
5
1. Event detection using preset threshold settings
Events exceeding thresholds are detected by setting thresholds for
various power quality parameters.
Up to 100 events can be saved to internal memory.
Up to 1000 events can be saved on PC card.
Events that occur simultaneously are correlated and treated as a
single event.
2. Event Analysis
Confirm when and what kind of events have occurred from the
Event List.
Each event can be analyzed using waveforms, vectors, harmonic
bargraph and related parameter values.
3. External input and output of events
A signal can be output when an event occurs. Also, an externally
applied signal can be set to be recognized as an event.
ΔV10 Flicker, IEC flicker measurement
Select either IEC flicker (Pst, Plt) regulated by international standards,
or ΔV10 Flicker commonly used in Japan, and measure with power
quality parameters.
Δ-Y and Y-Δconversion functions provided
Δ-Y conversion can be performed on three-phase 3-wire systems, and
Y-Δconversion can be performed on three-phase 4-wire systems. In
either case, line-to-line voltage or phase-to-neutral voltage display is
available.
Up to one month continuous measurement
Data is saved to internal memory during the measurement period.
Use of a PC card enables continuous measurement for one month at
maximum.
Time plot graph display
Fluctuations in various power quality parameters are displayed in time
plot graphs.
Calculated maximum, average and minimum values for each interval
are displayed.
Event detection functions
Easy-to-see TFT color LCD
The display is a 6.4-inch (640 x 480 dot) high-contrast, wide-viewing-
angle TFT color liquid crystal display. The screen is easy to see in
both bright and dark environments, and is capable of showing many
power quality parameters at the same time.

1.2 Features
6
RS-232C and LAN interfaces provided
Connect a PC, printer or modem for remote control and data output.
PC Card interface provided
Measurement and event data can be preserved by saving to a PC
Card.
Setting conditions and measurement data can be stored and read
back using a PC Card.
Seven selectable display languages
Select the display language from Japanese, English, German, French,
Spanish, Italian, or Chenese (Simplified).
Nickel-Metal-Hydride battery pack supplied
The Ni-MH battery backs up internal data when power is off.
When fully charged, data is backed up for 30 minutes when power is
turned off.
Compact and light weight
The compact size and light weight allows installation even in limited
space, such as in a cubicle.
Carrying case options for portability
The optional cases allow measurements to be taken without removing
the instrument. Choose from a light-weight soft case or water-resis-
tant hard case.
A choice of optional clamp-on sensors
Select either the 9660 CLAMP ON SENSOR (100 A rms rating), the
9661 CLAMP ON SENSOR (500 A rms rating), the 9667 FLEXIBLE
CLAMP ON SENSOR (500/ 5000 A rms rating), or the 9669 CLAMP
ON SENSOR (1000 A rms rating), 9694 CLAMP ON SENSOR (5 A
rms rating).
The 9657-10 CLAMP ON LEAK SENSOR and 9675 CLAMP ON LEAK
SENSOR also can be used.
Control instrument settings and data acquisition by
Web browser
HTTP server functions are built in
Instrument settings and data acquisition can be controlled by common
Internet Web browsers like Internet Explorer or Netscape Navigator.

1.2 Features
7
For detailed information on the EN50160, see the Instruction Manual
for EN50160.
Control instrument settings and data acquisition by
Web browser
HTTP server functions are built in
Instrument settings and data acquisition can be controlled by common
Internet Web browsers like Internet Explorer or Netscape Navigator.
PC application software (option) for analyzing a large
volume of data
By using the optional PQA-HiVIEW series, a large volume of long-term
measurement data recorded on a PC card can be analyzed.
Remotely downloaded application software provided
By using the Down96 download application supplied with the product,
data in the main unit can be downloaded from a distant location via
LAN or RS-232C (modem).
EN50160-compliant evaluations
Conforms to the European standard EN50160 (Voltage characteristics
of electricity supplied by public distribution systems) and suitable for
evaluation of the voltage quality of a power system.
Optional GPS BOX available for precisely timed mea-
surements
Using the XD112 GPS BOX, measurements can be precisely timed
using communications satellites.
Measurement is possible on 400 Hz power lines
Measure 400 Hz power such as that used for aircraft equipment and
shipping tests.
Because the usual shipping tests do not include 400 Hz measure-
ments, please advise when ordering if your application requires guar-
anteed accuracy at 400 Hz.

1.2 Features
8

2.1 Key Explanations
9
Key Explanations and Screen
Configuration Chapter 2
2.1 Key Explanations
Display
6.4-inch, TFT color
LCD display
F1 to F4 keys
Select or change display
or setting items.
Front Panel
POWER LED
This lamp lights when the power is on.
Powered by AC adapter: Lit green
Powered by battery pack: Lit red
SYSTEM/ VIEW/ TIMEPLOT/
EVENT key
Select the screen type according to
the intended usage
❖"Front Panel Enhanced
View"(page 10)
HARD COPY key
Prints a screen image, or outputs
the screen image as a file to a PC
Card.
ESC key
Ignores selected or changed items and returns the
original setting.
ENTER key
Used to set the
contents of items
that are selected or
modified.
DATA HOLD key
DATA RESET key
START/STOP key
Cursor keys
DF1 to DF4 keys
Press these Display Function
DF keys to select the type of dis-
play.
❖"Front Panel Enhanced
View"(page 10)

2.1 Key Explanations
10
SYSTEM key
Displays the [SYSTEM]screen (for select-
ing display of system settings).
Front Panel Enhanced View
DATA HOLD key
Temporarily stops display of measured values.
Pressagain tocancel. While recording, displayof the
measured value can be stopped for confirmation.
Cursor keys
These keys move the cursor on the screen.
Use to scroll the TIME PLOT screen.
DATA RESET key
Allmeasurementdataiserasedfrominternalmemory.
Press this key to reset before restarting recording.
EVENT key
Displays the [EVENT]screen (for selecting events).
VIEW key
Displays the [VIEW]screen (for se-
lecting an Analysis view) TIME PLOT key
Displays the [TIME PLOT]screen (for selecting
the time plot graph).
START/STOP key
Starts and stops recording.
To start recording, press the DATA RESET key
to reset the data, then press this key.
DF1 to DF4 keys (Display function)
Select a screen to display from the selected screen type: SYSTEM, VIEW, TIME PLOT or EVENT.
The screen selections are as follows:
[SYSTEM]screen.......... Wiring diagram, Main settings, Event settings, Load/Save, etc.
[TIME PLOT]screen..... RMS fluctuations, Voltage fluctuations, Harmonic fluctuations,
Flicker display, etc.
[VIEW]screen................ Waveforms, Vectors, DMM, Harmonic display, etc.
[EVENT]screen............List, Monitor, etc.

2.2 Screen Names and Configurations
11
2.2 Screen Names and Configurations
WIRING
•WIRING
• VECTOR
WAVE
• VOLT/CURR
• VOLTAGE
• CURRENT
RMS
• 1 ELEMENT
• 2 ELEMENT
EVENT
•LIST
• MONITOR
MAIN
• MEASURE
• RECORDING
• HARDWARE
VECTOR VOLTAGE
• INTERVAL
• EVENT
EN50160 *
• Overview
EVENT
• VOLTAGE
•POWER
• HARMONICS
DMM
•POWER
• VOLTAGE
• CURRENT
HARMONICS
• HARM
• INTERHARM
EN50160 *
• Harmonics
• Signaling
• Events
LOAD/SAVE
• MEMORY
• PC-CARD
HARMONICS
• GRAPH
•LIST
FLICKER
• GRAPH
•LIST
EN50160 *
• Setting1
• Setting2
• Setting3
Screen
Selection
Other Displays
Display
Selection
Internal Status
Indicator
Each screen type (SYSTEM, VIEW, TIMEPLOT and EVENT) displays the
following information in response to the DF keys.
Power ON
[RECORDING] [ANALYZING]
[SETTING]
* Used when the EN50160 function is ON.

2.2 Screen Names and Configurations
12
2.2.1 Common Display Areas
The display elements common to all screens on the 3196 are as fol-
lows.
Time Display
Shows the current
time.
Power Supply Indicator
Indicator Power supply status
White/ Red Powered by AC adapter
Battery pack is charging
White/ White Powered by AC adapter
Installed Battery Pack
White Powered by battery pack
White Powered by battery pack, but charge is low.
SYSTEM Settings
Indicators*5
Displays the contents specified
in MEASURE
Memory Usage
Indicators*3
Level meters indicate the usage
status of internal memory and
flash ATA card.
Interface & Hold/Lock
Indicators*4
Indicates interface usage and
HOLD/LOCK status.
Internal Status
Indicator*2
Indicates the current inter-
nal operating status.
Screen Selection*1
Indicates the screen type select-
ed by the corresponding key.
Number of repeated
recording operations*6
The number of repeated re-
cording operations currently
set will be indicated.
Top of Screen
Help Comment Display
Shows a brief description of the item at the cursor position on the SYSTEM screen.
Bottom of Screen

2.2 Screen Names and Configurations
13
*1:Screen Selection Display
*2:Internal Operating Status Display
If the preset measurement start time has already passed, measure-
ment starts immediately.
[SYSTEM]screen...............
[VIEW]screen....................
[TIME PLOT]screen ..........
[EVENT]screen .................
One of [SETTING], [RECORDING]([WAITING] until preset
time to start measuring), or [ANALYZING] is displayed to
indicate the internal status of the instrument.
The internal status is changed by pressing START/STOP to
start/stop recording.
Display Internal status description Real-time
measurement Recording status
[SETTING] Whenturnedon,thereisnorecorded data inthe
instrument Possible Preparation for re-
cording
(not recording)
[WAITING] Waiting until a preset start time to begin mea-
suring Possible
[RECORDING] Recording has started and measurement data
is being saved to the instrument’s internal mem-
ory (and perhaps to a PC Card)
Possible Recording in progress
[ANALYZING] Recording has finished and the instrument is
ready for analysis of the measurement data in
internal memory
Possible Recording finished
Normal Measurement
Measurement starts Measurement finished
[SETTING] [RECORDING] [ANALYZING]
Measurement with Specified Time Settings
Starts measurement at the
measurement start time. Finishes measurement at
the measurement end
time.
[SETTING] [WAITING] [RECORDING] [ANALYZ
-
ING]

2.2 Screen Names and Configurations
14
*3:Memory Usage Indicators
*4:Status Icons
*5: SYSTEM settings display
INTERNAL MEMORY: Internal memory
PC CARD MEMORY: ATA flash card
INTERNAL MEMORY
TIME PLOT related data capacity
Measurement stops when memory becomes full.
(Selectable Stop/Continuous)
Up to 100 EVENT data sets can be stored
After 100 events are stored, the earliest are overwritten.
Total capacity: 5 MB
Total capacity: 8 MB
Interface usage status indicators
Indicates the printer is ready for use.
Indicates the modem is ready for use.
Indicates the LAN interface is ready for use.
HOLD/LOCK status indicators
Indicates the DATA HOLD key has been pressed to
activate the Data Hold function.
Indicates the KEY LOCK switch has set to lock the
keys.
PC card status display
Lights when the PC Card is being accessed.
Measurement Line type
Set on the SYSTEM screen
Voltage/Current Range
Red Indication: means out of range
In this case, increase the range set-
ting.
Frequency of Measured
Line
Red Indication: means the mea-
surement frequency is different
from the line frequency
PLL Sync Frequency source
Indicates red when no input is applied at the
selected source.
CH4 Voltage measure-
ment function
(AC/ DC/OFF)
PT(VT)/CT Ratio
[SC](scaling):AppearswhenthePT
or CT ratio has been set.
[(Not displayed)]: when the PT and
CT ratios are both 1.
Other manuals for 3196
3
Table of contents
Other Hioki Measuring Instrument manuals

Hioki
Hioki MEMORY HiCORDER MR8870-20 User manual

Hioki
Hioki PQ3100 User manual

Hioki
Hioki 3197 User manual

Hioki
Hioki 8846 User manual

Hioki
Hioki lr5001 User manual

Hioki
Hioki Memory HiCorder MR6000 User manual

Hioki
Hioki CT6710 User manual

Hioki
Hioki PR8111 User manual

Hioki
Hioki PW3365 User manual

Hioki
Hioki PW3198 User manual

Hioki
Hioki TM6101 User manual

Hioki
Hioki IM3536 User manual

Hioki
Hioki CM4371 User manual

Hioki
Hioki IM7580A Series User manual

Hioki
Hioki 9605 User manual

Hioki
Hioki BT4560 User manual

Hioki
Hioki CT6845-05 User manual

Hioki
Hioki PW8001-01 User manual

Hioki
Hioki 3661-20 User manual

Hioki
Hioki 9465-10 User manual