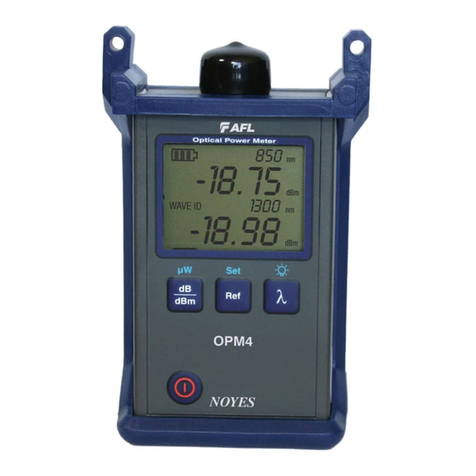
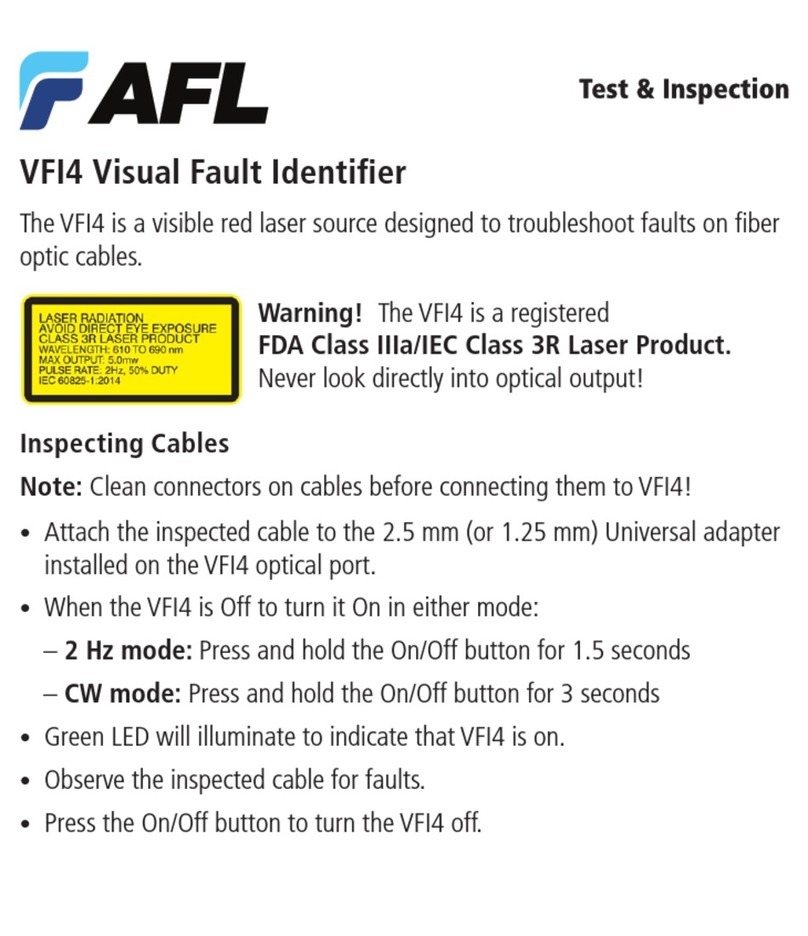
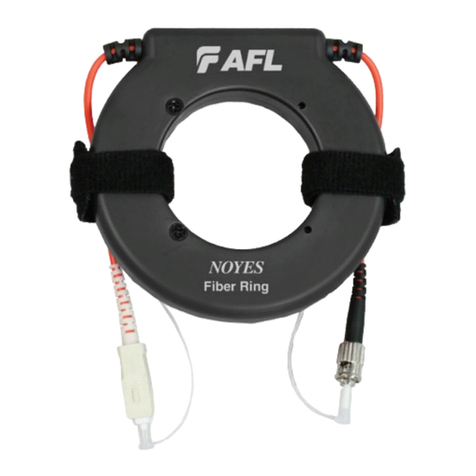
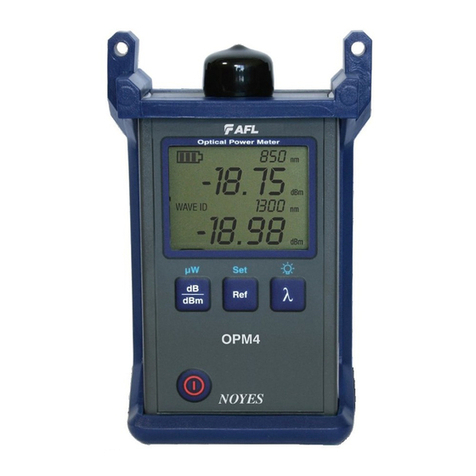
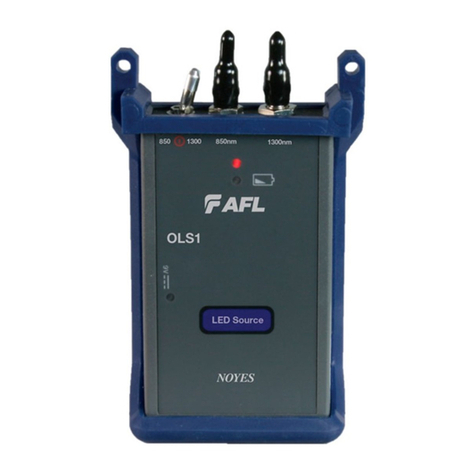
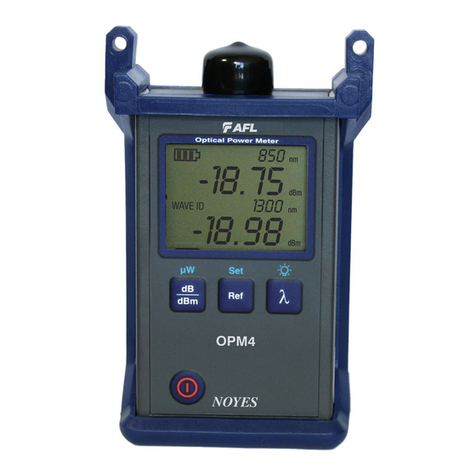
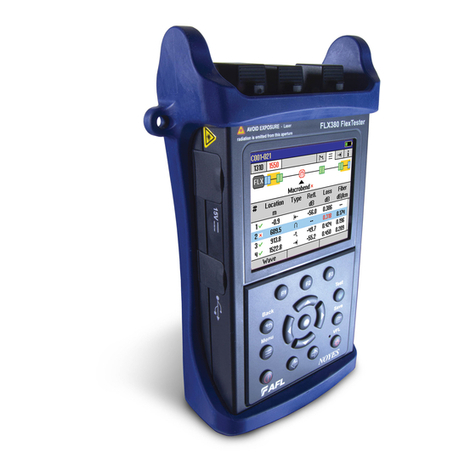
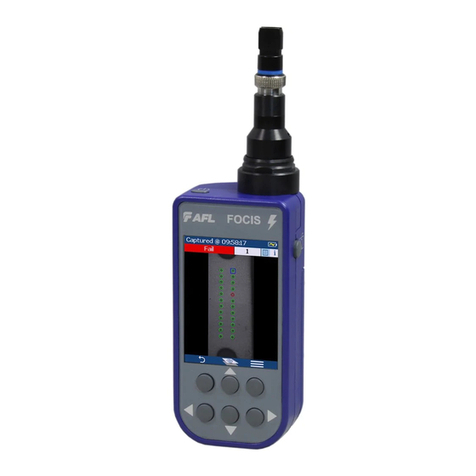
AFL FlexScan FS300 User manual

FlexScan®FS300 OTDR
With SmartAuto®and LinkMap®
Quick Reference Guide
www.AFLglobal.com or (800) 321-5298, (603) 528-7780
Test & Inspection

2
1 Power button
2 Power jack (5 VDC)
3 Charge/AC indicator
4 USB host port
5 Micro-USB function port
6 MM OTDR/Source port
7 SM OTDR/Source port
1
2
3
4
5
6
7
Controls, Display, Interfaces
8 VFL port
9 Power Meter port
10 Touchscreen display
11 Home button
12 Start/stop test button
13 VFL button
14 VFL indicator
8
9
10
11
12
13
14
Battery Charging
• Plug the included AC charger into AC outlet.
• Connect charger plug to power jack 2.
• LED 3indicates charging status as follows:
OFF - AC not connected
RED - Charging battery
GREEN - Fully charged
• FlexScan charges while operating.
Configure FlexScan to Auto-Off
• From the Home screen, select Settings menu.
• Locate and select the Auto Off Timer menu.
• From the Auto Off Timer menu, select the desired
power save option (Never, 5 min, 15 min).
4
7 862
11
12
13
Reserved
10
14
3
9
1
5

3
Home Screen
The Home screen is displayed at FlexScan startup. This screen contains menus of Test and Utility modes that allow
users to set test parameters, select user preferences, manage saved test results, congure general settings and
perform other non-test functions. While in any other screen, return to Home by either pressing the Home button
or touching Back .
Test Modes and Features Summary
1 SmartAuto®OTDR (recommended): Congure and run SmartAuto OTDR test using multi-pulse
acquisition.
2 Expert OTDR: Congure and run Expert OTDR test with averaging.
3 Real Time OTDR: Congure and initiate OTDR test with real-time updates.
4 Power Meter & Source (OPM + OLS): Measure power
and loss; generate ber ID Tones; enable light source.
5 Connector Inspection: View connector inspection
results received via Bluetooth from FOCIS Flex probe.
Utility Modes and Features Summary
6 My Projects: Touch to view test results.
7 USB: Touch to enable le transfer to/from PC.
8 Last: Touch to view the most recent test results.
9 Settings: Touch to congure General Settings.
10 Menu: Touch to view Device Information screen.
11 USB: Indicates external USB memory stick detected.
12 Battery Icon: Indicates battery charge level.
1
2
3
4
5
6
7
8
9
10
11
12
4
5
6
8 9 107
2
1
3
11 12

4
Configure and Initiate SmartAuto®OTDR Test
SmartAuto OTDR Settings Summary
1 Network Type. Touch to select one of the following:
–FTTH PON, Single-mode
–Point-to-point, Single-mode
–Point-to-point, Multimode
• If FTTH PON Aselected, congure splitters.
–Tap each expected splitter eld (located below PON
diagram - B) to display a sub-screen and congure
split ratio. Up to 3 splitters may be congured.
–If Auto Cselected– FS300 automatically detects
splitters and reports split ratio based on loss.
Note: If Auto selected, excess loss at splitter may
result in incorrect split ratio being reported.
11
A
B
C

5
Configure and Initiate SmartAuto®OTDR Test
2 6
34 5
D
E
F
1 Fiber Type. Select one of the following:
–Multimode OMx or User
–Single-mode G.65x or User
2 Launch & Tail Cord:
–DTouch Launch Cord to congure length of
launch cord, if present.
–ETouch Tail Cord to congure length of tail
cord, if present.
–FTouch Launch Quality Check to enable/
disable. When enabled, FS300 checks OTDR
connection to launch cord or jumper cable at
start of test.
3 Pass/Fail Rule: Indicates selected LinkMap
event pass/fail rules.
–Touch to select ITU G.671, TIA-568.3-D or
User.
Note: OTDR test results evaluated against
selected or congured rules:
4 Touch to initiate SmartAuto test.
5 Touch Back () to return to Home screen.
2
3
4
5
6

6
Live Fiber Detection
To prevent service disruption on live PONs, FlexScan performs a Live
Fiber check prior to every OTDR test. If a live ber is detected,
FS300-325 models display a warning screen A
and do not allow testing.
Launch Quality Check
An optional launch quality check enables users to detect dirty,
damaged, poorly seated, or mismatched (UPC to APC) connectors.
To perform the launch quality check:
1. With the Launch Quality Check option Benabled in the OTDR or
General Settings screen, initiate an OTDR test.
2. The FlexScan will assess the loss and reectance at the OTDR’s
connection to the launch cord (ber ring) or ber under test.
3. If excess loss or reectance is detected, the OTDR displays the
‘Launch Quality is Poor’ warning screen C. From this screen the
user may chose to perform one of the following:
–Cancel a test by touching either Cancel Dor Back E.
–Clean connectors, then repeat the launch quality check by
touching Re-check F.
–Continue testing without checking and cleaning the connection by
pressing Continue G.
Note: Testing a ber with poor launch quality may produce poor test results.
OTDR Modes: Live Fiber Detection and Launch Quality Check
A
C
ED G
F
B

7
OTDR Test Results Views
SmartAuto®OTDR and Expert OTDR: Test results may be displayed in four views as follows:
1 LinkMap View - displays an icon-based representation of the network.
2 Event Table View - displays measurements for the currently selected Link Summary, Event, or Section.
3 Trace View - Displays OTDR trace(s),
graph scale (dB/div & m/div), A/B cursor locations, A-to-B cursor
distance, loss, reectance and loss/distance measurements.
4 Test Info View - displays summary of OTDR settings used for
this test.
To display each view touch the associated tab.
Real-time OTDR: Test results are displayed in Trace View 3only.
1
2
3
4
2
23 4
34
Event Table View
Trace View Test Info View
LinkMap View
1
1

8
Testing in SmartAuto®OTDR Mode
Initiate the SmartAuto test by touching Start soft key or pressing Start/Stop button.
1. FlexScan begins testing with the Live Fiber check and if a live ber is NOT detected, proceeds to next step.
2. If the Launch Quality check is enabled, FlexScan checks loss and reectance of the OTDR connection.
3. If launch quality is good, FlexScan starts testing at both wavelengths using SmartAuto settings.
4. When testing is completed, FlexScan displays the LinkMap®screen, which is a primary display in SmartAuto
OTDR mode.
LinkMap®View Features
LinkMap is an icon-based representation of the analyzed network.
Link map thumbnail view with
proportionally spaced events
x/y or x1-x2/y, where
x = number of the selected event
x1-x2 = link section between events,
y = total events
File name: consists of cable
name and ber number, or “New
Trace” if le has not been saved
Link Length
Menu key: touch to
navigate to Save As screen
Back key: touch to return
to the previous menu
LinkMap detail view: shows
summary and rst 4 events,
or up to 5 events. White
highlighted area in thumbnail
view indicates region of ber
for which events are shown
in the detail view. Touch
an event icon to see more
details about that event.

9
LinkMap®View Features
LinkMap tab: when in any
other test results viewer
(Event Table View, Trace
View, Test Info View), touch
to return to LinkMap View
Details of the currently
selected Summary, Event,
or Section
Swipe or Use arrows to move
to next or previous event or
link section
Event Table tab: touch to view
measurements for the currently
selected Link Summary A, Event B,
or Section C
Trace tab - touch to display Trace
view that depends on selection:
Selection Display View
Summary Trace of entire network
Event Trace around event
Section N/A
Link Summary icon: may be
green (all events passed), red
(one or more events failed) A
Link Section between events
Info tab: touch to display
summary of OTDR settings
used for this test
Event icon: event icons may be green (pass) or red (fail).
Pass/fail is based on event loss and reectance thresholds
congured by the currently selected Pass/Fail Rule. Touch
an event icon to see details about that event.
B
C
Selection marker indicates
selected icon: Summary,
Event, or Section

10
Trace View Features
Touch to display Menu
function (Save As, Print to
PDF, etc.)
Loss between A and B cursor
Loss-per-distance between A
and B cursors
Maximum Reectance
between A and B cursor
OTDR traces
Launch cable (if present)
Fiber under test
Distance from A to B cursor
Touch to toggle between
Zoom and A|B Cursor
Control modes
Touch to switch to the
LinkMap view
Touch to return to the
previous screen
Trace View is accessed from any other results view
by touching the Trace tab. Trace View displays
OTDR trace(s), graph scale (dB/div & m/div), A/B cursor
locations, A-to-B cursor distance, loss, reectance and
loss/distance measurements.
Graph scale (dB/div & m/div)
• Touch the desired wavelength make it active.
• White background indicates active wavelength.
• Cursor measurements apply to active wavelength.

11
Trace View – Cursor Control Enabled
Jump active cursor to the Next
Event
Jump active cursor to the
Previous Event
Lock / Unlock A/B cursors (when locked, cursors move together). A|B
Cursor locked icon toggles to show expected function when touched (e.g.
if A|B currently locked, icons shows unlock A|B)
Nudge active cursor Right
Nudge active cursor Left
Cursor Control enabled
Cursor B location (B is inactive cursor). Touch
non-highlighted cursor box to make cursor active.
Cursor B is always located to the right of cursor A.
Cursor A location (A is active).
Yellow highlight indicates the
currently active cursor. Cursor
A is always located to the left
of cursor B.
A and B cursors. Touch and drag in trace display area to
move the active cursor to the desired location Event Marker:
• Green - Passing event; Red
- Failing event, Blue - Not
evaluated event.
• Touch Event marker to move
active cursor to that event

12
Trace View – Zoom Control Enabled
Touch to zoom out vertically
on the active trace around the
currently active cursor.
Touch to zoom in horizontally on the active
trace around the currently active cursor.
Touch to Unzoom (if zoomed in);
Touch to Rezoom (If zoomed out).
Touch to zoom in vertically on
the active trace around the
currently active cursor.
Touch to zoom out
horizontally on the active
trace around the currently
active cursor.
Zoom Control enabled
Cursor B location (B is inactive
cursor). Touch non-highlighted cursor
box to make cursor active. Cursor
B is always located to the right of
cursor A.
Cursor A location (A is active). Yellow
highlight indicates the currently active
cursor. Cursor A is always located to
the left of cursor B.
Note:
• Zoom In/Out centers trace
about a point where the active
cursor intersects with the active
wavelength trace.
• Unzoom / Rezoom icon toggles
to show expected function
when touched (e.g. if zoomed
in, icon shows Unzoom state).
• Pinch in trace area to zoom
(horizontally or vertically).
• Swipe in trace area to pan
display (horizontally or
vertically).

13
Printing Results to PDF
Saved test results may be organized into reports and printed to PDF
le format as needed.
1 Navigate to the desired test results and touch Menu ( ) from the
results display.
2 Touch Print to PDF from the displayed menu.
3 Select options to include cover page and congure content of
printout.
–Scroll to congure additional options.
4 Touch Done to complete setup and generate PDF report.
–Generated PDF report will saved to the same
RESULTS > TRACES > PROJECT folder as test results.
5 Touch OK when done.
Uploading PDF reports to PC
• Connect FlexScan to PC (via FlexScan’s micro-USB function port
and USB port on a PC).
• On FlexScan, enable USB mode (on Home screen).
• On PC, navigate to FS300 (X:) > RESULTS > TRACES >
”Destination PROJECT folder”.
• Upload PDF report from FlexScan to PC.
Note: Future software update will allow PDF to be sent to another
device via Bluetooth or WiFi (Bluetooth/WiFi option required).
1
2
3
4
5
2
1
4
5
3

14
Back Up Saved Results to USB Memory
To back up internally stored results to USB memory stick:
1 Plug external USB memory stick into FlexScan.
2 From the Home screen, touch ‘My Projects’.
3 If Folder Up icon is shown, touch it to navigate up to
Projects level until icon disappears 3.1 .
4 Verify that Internal Memory is currently selected - memory
card icon is shown.
–If USB selected, touch USB memory icon to toggle to
internal memory.
5 Touch Menu icon .
6 Touch Backup.
7 Wait until “Writing backup to USB drive…” completes.
1
2
3
4
5
6
7
2
5
6 7
3
4
3.1

15
General Settings
While in the General Settings screen, touch the desired setting eld to
display a sub-menu and perform settings as follows:
1 Select Language (added in future update)
2 Select Distance Units
3 Congure WiFi
4 Set Speaker volume
5 Set Date and Time
6 Set Auto Off Timer
7 Enable/congure Bluetooth
8 Set brightness and auto-dim
9 Congure Remote Control
10 Enable/disable Launch Quality Check
11 Enable/disable Screenshot capture. If enabled,
capture current screen using Home button .
Captured screenshots may be uploaded to PC via
micro-USB port.
12 Display received FOCIS Flex results in popup window or save in background
13 Congure MPO Switch Control (if Switch connected and enabled)
14 Restore Factory Defaults
1
2
3
4
5
6
7
8
9
10
11
12
13
14
3
4
2
1 5
6
7
8
9
10
11
12
13
14

16
Source Settings and Features
1 Touch to enable/disable light source. RED Laser
Aindicates that source is ON.
2 Touch to select test mode: Wave ID, CW, Tone
(270 Hz, 330 Hz, 1 kHz, 2 kHz).
–Select Wave ID mode for fastest loss
measurements. While in this mode, the
FlexScan source transmits wavelength
information, enabling a Wave ID power meter
to synchronize and measure power at received
wavelength(s).
–Use CW mode to generate continuous wave
light at a single wavelength.
–Generate Tone for ber identication (270 Hz, 330 Hz, 1 kHz, 2 kHz).
3 Touch to select test wavelength: 850 nm, 1300 nm, 1310 nm, 1550 nm.
Power Meter Settings and Features
4. If used with non Wave ID source, touch to select wavelength. If used with Wave ID source, power meter
automatically synchronizes to and indicates received wavelength(s).
5 Hold to store new reference(s) at received wavelength(s). Touch Ref/Set to view stored reference(s).
6 Touch to toggle between power (in dBm or Watts) and loss (dB) mode.
Note: Power meter detects and indicates ber identifying tones when used with a light source capable of
generating a modulated Tone signal.
1
2
3
4
5
6
Light Source and Power Meter Operation
1 2 3
Source Meter
4
5
6
A

17
File Manager
Fiber test results Amay be stored in the FlexScan internal memory or external USB stick.
Saved test results are organized into a Fiber Group sub-folder Bwithin a Project folder C.
Fiber GroupsResults - Fibers
A name of the saved result consists of several parameters, which are
dened in the Save As screen D.
Projects
Save As Screen D
B
E
C
F
G
A
End 1_End 2_Cable_Fiber#_Wavelength
Fiber Group Name
E
Fiber#
S13 for 1310 nm
S15 for 1550 nm
M85 for 850 nm
M13 for 1300 nm
• Touch Results Fto display File Manager and navigate to the desired Project / Fiber Group folder.
• Project, End 1, End 2, and Cable are user-dened in Text Editor.
• Fiber number auto-increments after each save, but can be modied in Number Editor as needed.
• Touch Done Gwhen nished.
For Bi-directional OTDR reports, results must be obtained and stored from each end of the network:
• Use same test settings (range, pulse width, etc.) in both directions; Use same launch and receive cables in both
directions; Swap End1, End2 names; Bi-directional averaging and report generation is performed using TRM 3.0.

18
1
2
Saving Results
1 While in the Results view, touch Menu icon .
2 Touch ‘Save As’.
3 Edit [Project], [End1], [End2], [Cable] and [Fiber#] names used to
identify saved results: touch any eld to edit it. Touch Done when
nished.
4 Select if results are to be saved in SOR and/or PDF le format.
5 Touch Results to view, navigate and select destination Project/
Fiber Group folder. Touch Back to return to Save As screen.
6 If needed for bi-directional testing: Touch Menu ;
then touch Swap Ends.
7 Touch Done to save test results.
1
2
3
4
5
6
7
4
5
7
6
3
33
33
Saving Results for Bi-directional Reporting:
• Results must be obtained and stored from each end of the network.
Bi-directional averaging and report generation is performed using
TRM 3.0.
• To ensure TRM can associate results from both ends, proper naming of test results is critical:
• Use same Project name and Fiber Group name when testing from each end.
• Fiber Group name created from End1, End2 and Cable names.
• Use same End1 and End2 names.
–End1 and End2 names must be swapped when testing from End2.
–Reset ber number to same starting ber when testing from End2.

19
Recalling Saved Test Results
To View Saved Test Results
• From the Home screen, touch ‘My Projects’ A.
• Navigate through Project/Fiber Group/Fiber screens to locate the desired
test record, then touch it to display test results.
–Touch up/down keys Bor swipe to scroll up/down through list of les.
–Touch Folder Up icon Cto navigate up to Fiber Groups or Projects
level.
–Touch the Memory/USB icon Dto toggle between USB memory stick
and internal memory card (if USB stick present).
Fiber Groups Fibers
©2019 AFL , all rights reserved. FS300-00-1ENG Revision AB 2019-03-27
Refer to the FlexScan User’s Guide (available on the supplied CD or USB stick and www.AFLglobal.com).
Touch to display test results
Touch the desired folder from
the list Ato open it
Projects
A
AB
Touch to move up one
directory level
A
CC
Touch this icon to toggle between Internal Memory and USB (if USB stick present)
DDD

www.AFLglobal.com or (800) 321-5298, (603) 528-7780
Test & Inspection
Thank you for choosing AFL Test & Inspection!
A
F
L
T
e
s
t
&
I
n
s
p
e
c
t
i
o
n
Other manuals for FlexScan FS300
2
Table of contents
Other AFL Test Equipment manuals
AFL
AFL ROGUE cB1 User manual
AFL
AFL FOCIS Duel User manual
AFL
AFL FOCIS WiFi2 User manual
AFL
AFL M710 Series Installation instructions
AFL
AFL MFIS User manual
AFL
AFL FOCIS Lightning 2 User manual
AFL
AFL FlexScan FS200 OTDR User manual
AFL
AFL VFI 2 User manual

AFL
AFL FOCIS Lightning 2 User manual
AFL
AFL OFI-BI User manual
