Hioki MR8875 User manual

MEMORY HiCORDER
Measurement Guide
MR8875
March 2014 Revised edition 2 MR8875A983-02 14-03H


Introduction
1
Thank you for purchasing the HIOKI Model MR8875 Memory HiCorder. This Measurement Guide includes
basic examples of how the instrument is used. Please read it carefully before using the instrument.
Convenient functions (p.18), measurement examples (p.19), and reference information (p.21)
Introduction
Screen Organization
and Operational
Overview (p.2)
Measurement
Preparations (p.5)
Configuring Settings
before Measurement
(p.7)
Performing
Measurement (p.11)
Analyzing
Measurement Results
(p.12)
TheWaveformscreenallowsyou toviewmeasurementdata,whilethe
Settings screen allows you to configure various instrument settings.
Basic settings can also be configured on the Waveform screen’s
settings windows. (This manual covers the settings that can be
configured on the Waveform screen in its description of how to op-
erate the Waveform screen.)
Be sure to read the "Operating
Precautions" and "3.3 Pre-Mea-
surement Inspection" sections of
the instruction manual before us-
ing the in-
strument.
Configure measurement conditions.
Configure input channels.
Configure triggers (identification conditions).
Configure data saving, calculations, and other settings as neces-
sary.
If you wish to save data or perform calculations automatically after
starting measurement, these settings must be configured before
measurement. Data can be saved in a variety of formats, and cal-
culations can be performed after measurement.
Alternately, recording
stops when the set condi-
tions are satisfied.
This section describes operations and analytical methods that are
frequently used on the Waveform screen.
AB

Screen Organization and Operational Overview
2
Part names
Screen Organization and Operational Overview
Analog input terminals
(BNC terminals)
Connect optional connection
cords, clamps, and other input
sources here.
Battery compartment cover
Install the Z1003 Battery Pack here.
Ventilation holes
(Do not block.)
POWER (LED)
Turns green when the power is on.
CHARGE (LED)
Turns orange when the instru-
ment is charging.
HELP key
Displays an explanation of the
screen display.
(forced trigger) key
Applies a user-specified trigger.
SAVE key
Saves data manually.
START key
Starts measurement. The key
turns green while measure-
ment is in progress.
STOP key
Stops measurement.
T
USB cable slot
Connect the included USB cable when con-
necting the instrument to a PC.
USB flash drive slot
Connect a USB flash drive here.
100BASE-TX connector
Connect a LAN cable here.
LOGIC terminals
Connect optional logic probes.
SD memory card slot
Insert an SD memory card.
Input modules
(up to 4 can be installed)
UNIT 2
UNIT 4UNIT 3
Back Front
Top
Left side Right side
CH1-1 CH1-4
UNIT 1
AC adapter socket
POWER switch
External power supply
terminals
External control terminals
KEYLOCK switch

Screen Organization and Operational Overview
3
Screen organization
Waveform screen
[Channel] screen
[Calculation] screen
[Status] screen
[Trigger] screen
Configures input channels. You can also config-
ure the channel display and other functions.
Configures the measurement method. You can
also configure the waveform display, auto save,
and other settings.
Configure when you want to start and stop re-
cording based on a specific signal. Configures settings related to waveform value
calculations.
You can change various settings on the Wave-
form screen’s settings windows.
Switches between the Waveform screen and the Settings screen.

Screen Organization and Operational Overview
4
Screen operation
[File] screen[System] screen
Configures the system environment, external
I/O, and communications. Displays files on media and configures settings
such as the method used to save data.
Tap
Touch the screen with your fin-
ger and then remove your finger.
Touch
Touch the screen with your finger
for a longer amount of time.
Drag
Move your finger while touching
the screen.
Switching screens Changing settings
The setting will change
each time you tap the
screen.
Select from a list
A more detailed tab will be dis-
played. Tap the screen button again
to return to the previous display.
Increases or decreas-
es the value by 1.
Increases or de-
creases the value.
You canchange the value
fromthevalueinputpanel.
Example:
You can switch between the
Waveform screen and the Set-
tings screen.
You can display various settings
windows on the Waveform
screen and use instrument func-
tions. You can also switch pages.

Screen Organization and Operational Overview
5
1. Measurement Preparations
Connecting the instrument
Before using the instrument, be sure to read the “Operating Precautions” and “Pre-Measurement
Inspection” sections of the instruction manual.
(Example: Connect the
MR8901 Analog Unit
connection cord.)
Turn on the instrument. Connect to the
measurement target.
Insert media
(SD memory card or USB flash drive).
Only an SD memory card can be used when
saving data in real-time.
1
2
4
3
5
Connect the measurement cables to
the input module.
Connect the AC adapter.
If using the optional battery
pack, see the instruction
manual.
Setting the clock
The time is displayed on the bottom right of the screen. Change the time if it is not correct.
Tap [Apply] to accept the settings.
To return to the previous screen without changing the
time, tap [Close].
Tap [Time Setting].
The Settings window will open.
Tap the field you wish to change and set the
desired value.
Open the screen.
[Setting Display] [System] [Initialize]
1
2
2
1

Screen Organization and Operational Overview
6
Performing zero adjustment
[Zero Adjust] [Yes]
Perform zero adjustment.
Set the display to [Detail].
This procedure compensates for input module differences and sets the instrument’s reference potential to
0 V. (MR8901, MR8902 and MR8905 only) Zero adjustment can be performed for all input modules at
once.
For more precise measurement, allow a warm-up period of about 30 minutes to elapse after turn-
Open the screen.
[Waveform Display] / [Setting Display]
[Channel] [Analog]
1
2
3
2
3
When using the MR8903 Strain Unit
Zero adjustment cannot be performed for the
MR8903. Instead, perform [Auto Balance]. For
more information, see the instruction manual.
1

Screen Organization and Operational Overview
7
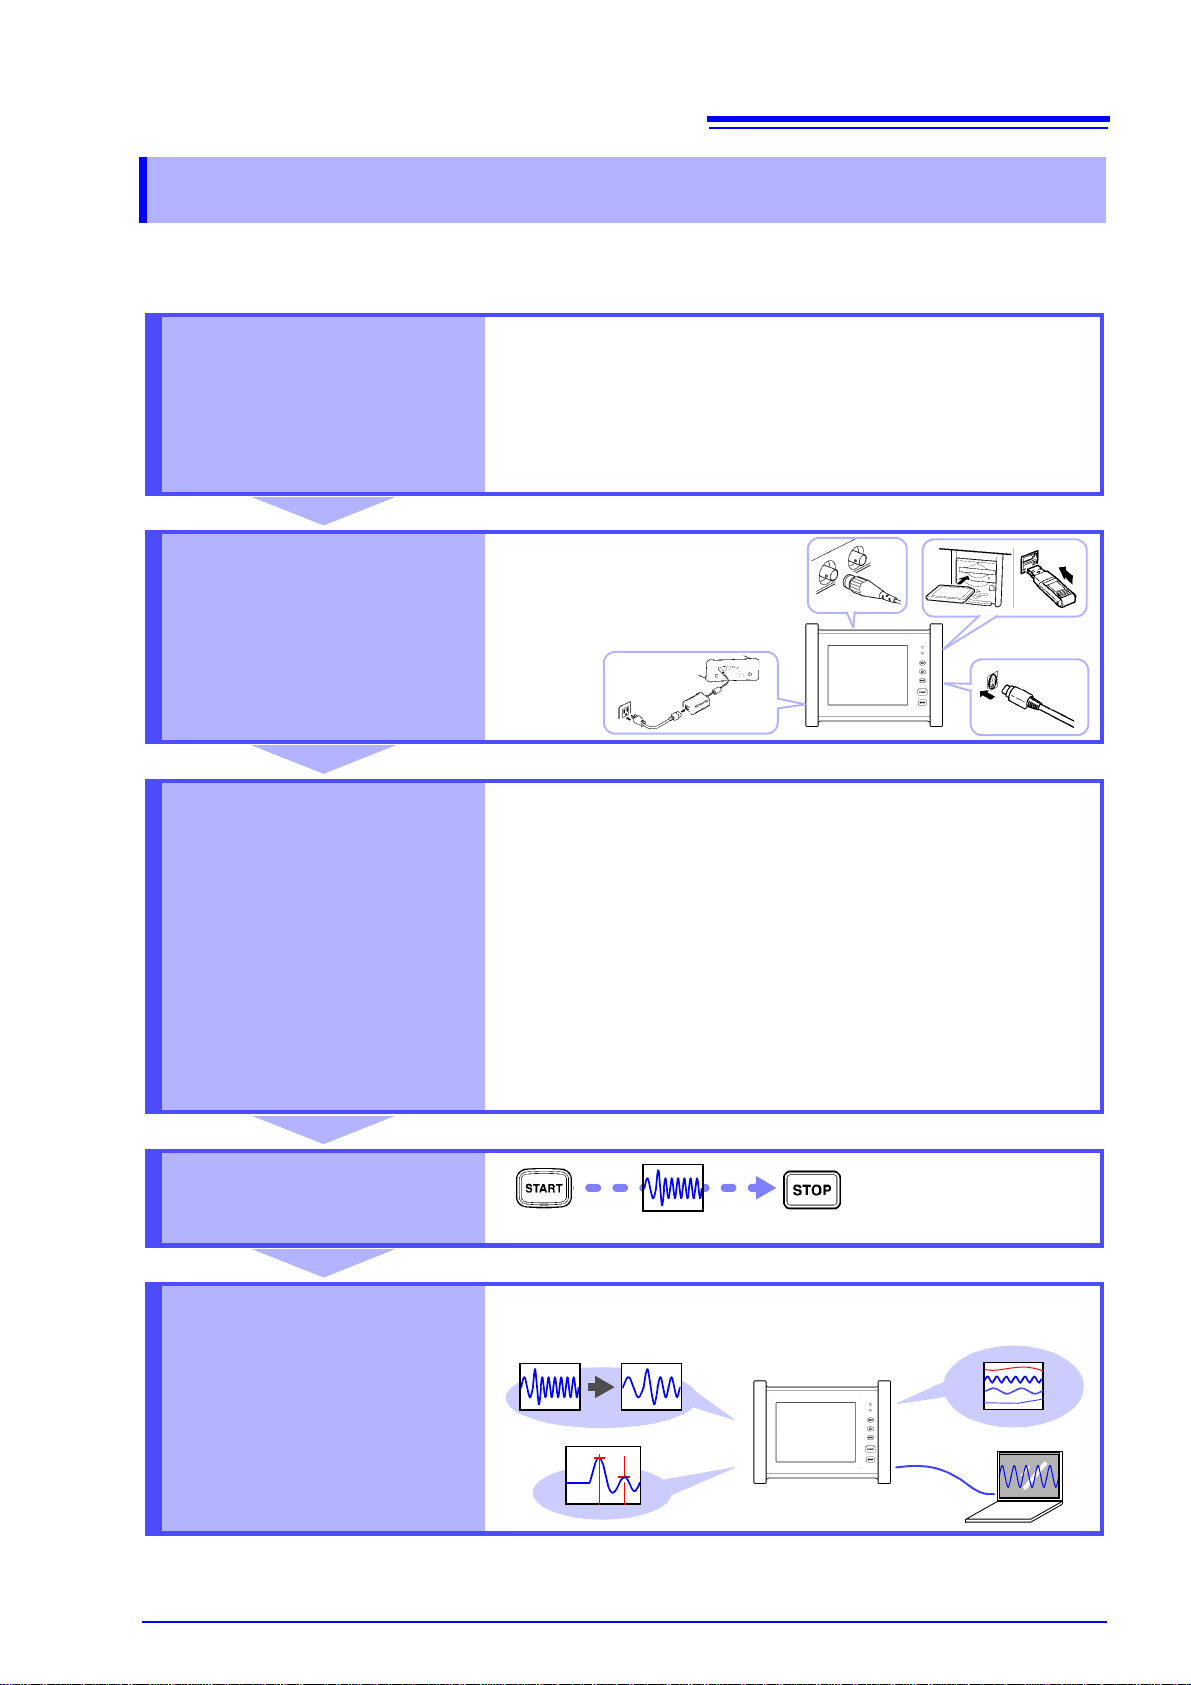
Before starting measurement, it is necessary to configure measurement conditions, input channels,
triggers, and other settings. To save data automatically after starting measurement, it is necessary to
configure data save settings before measurement.
Measurement and save methods
There are two methods for saving data, as explained below: you can save data automatically after
starting measurement, or you can save data manually (with the SAVE key) after measurement is com-
plete. This manual describes how to save waveforms automatically while performing measurement
using the MR8901 Analog Unit. For other more detailed information, see the instruction manual.
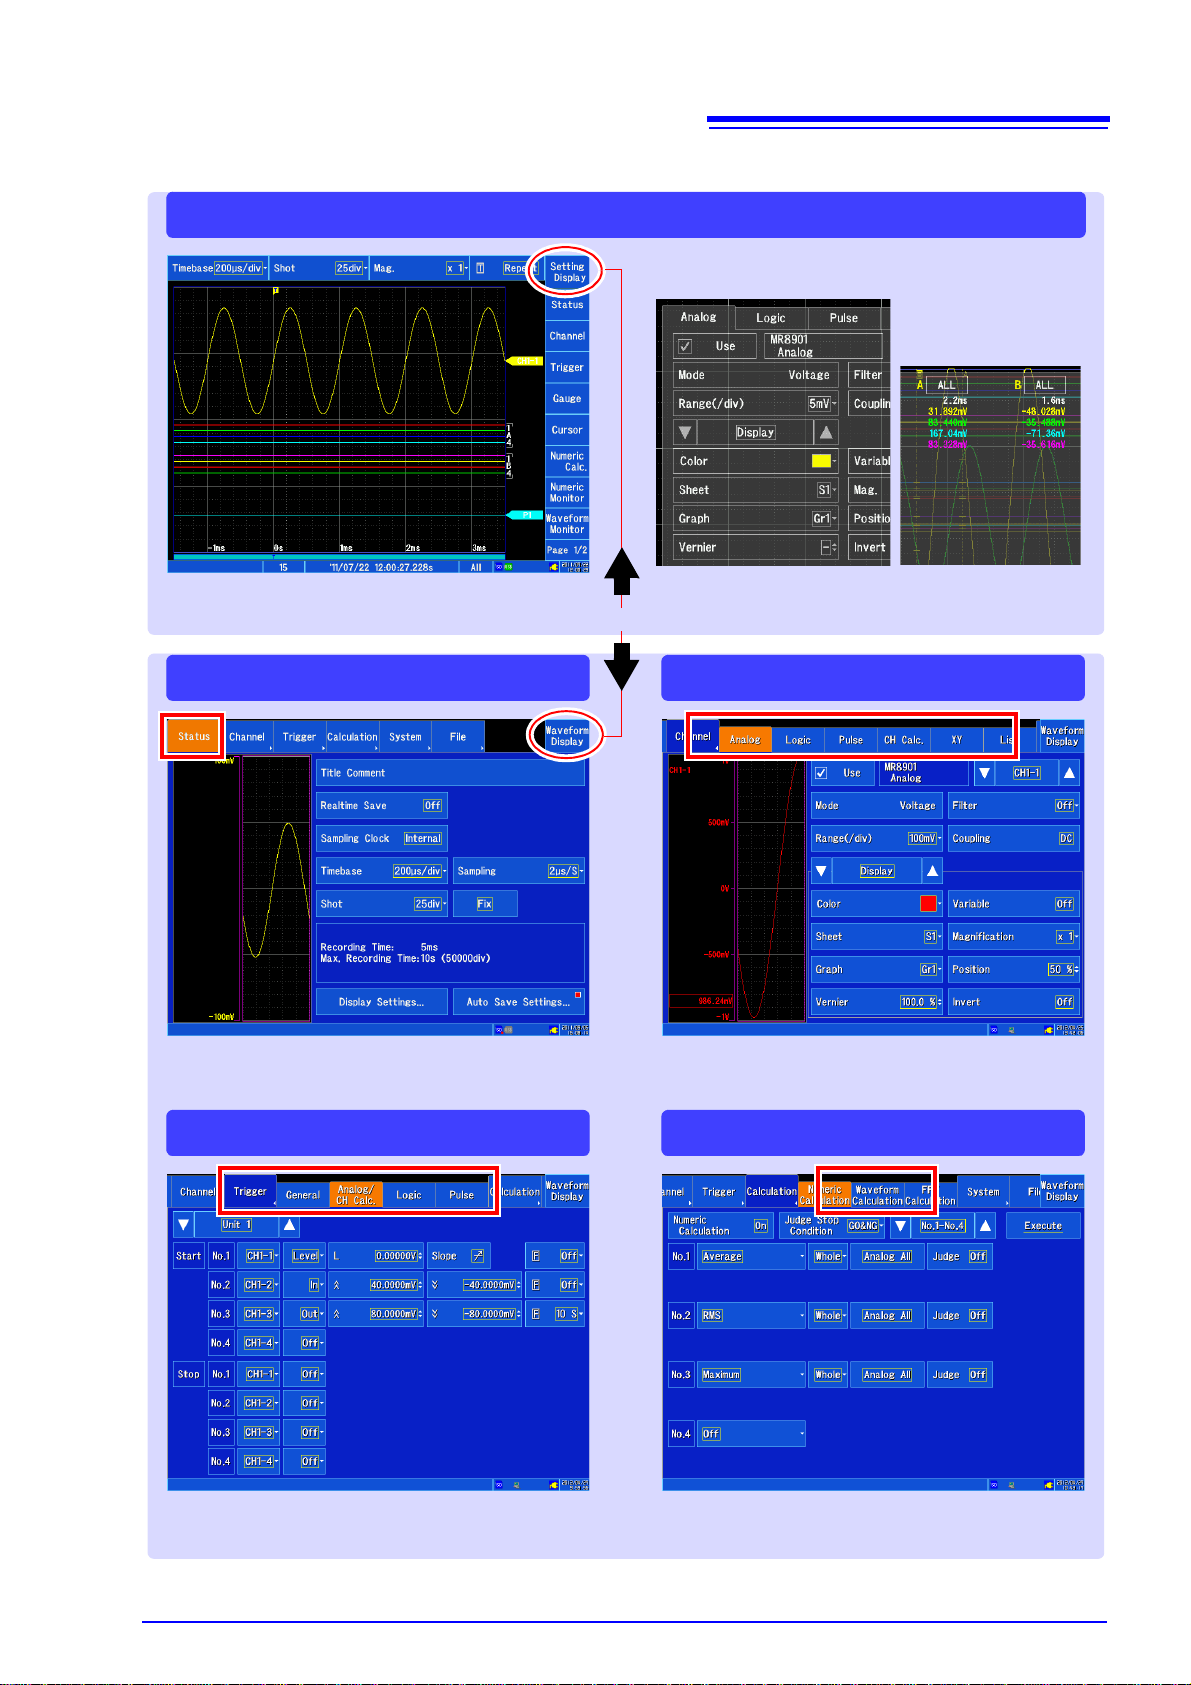
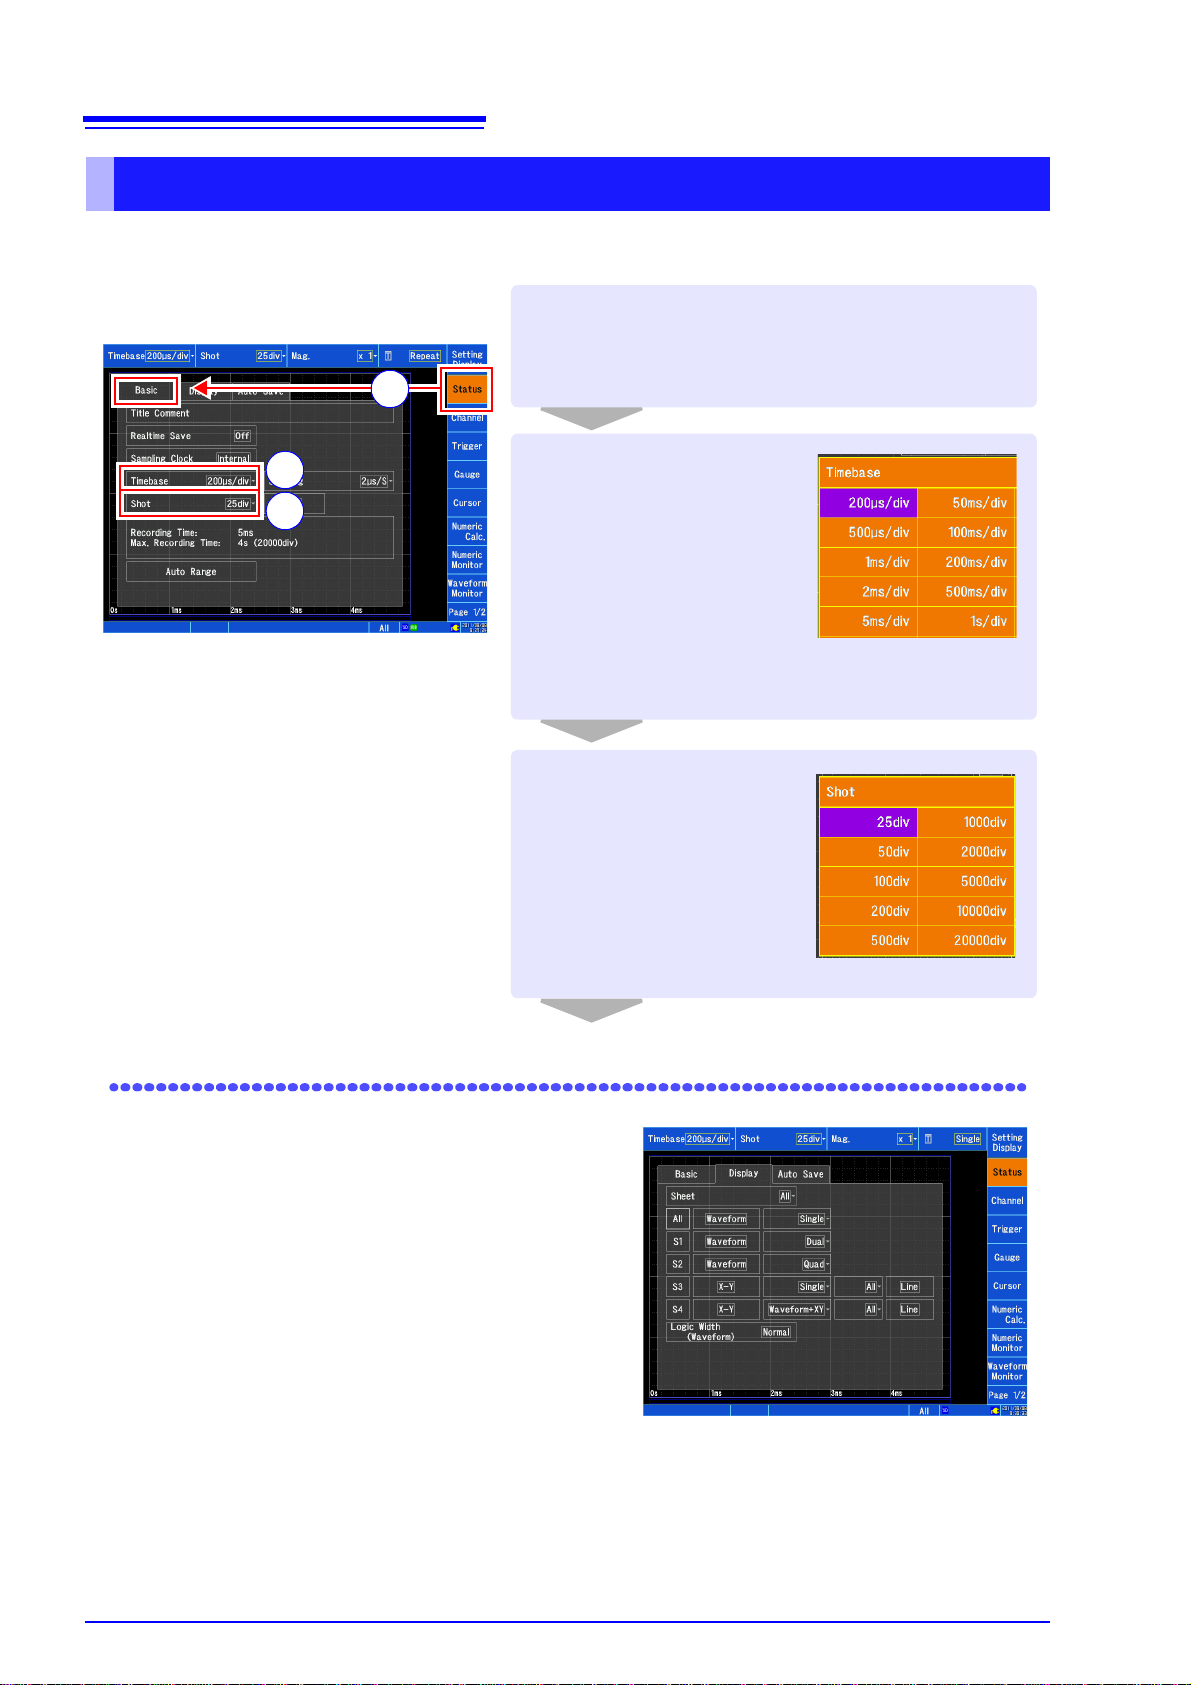
2. Configuring Settings before Measurement
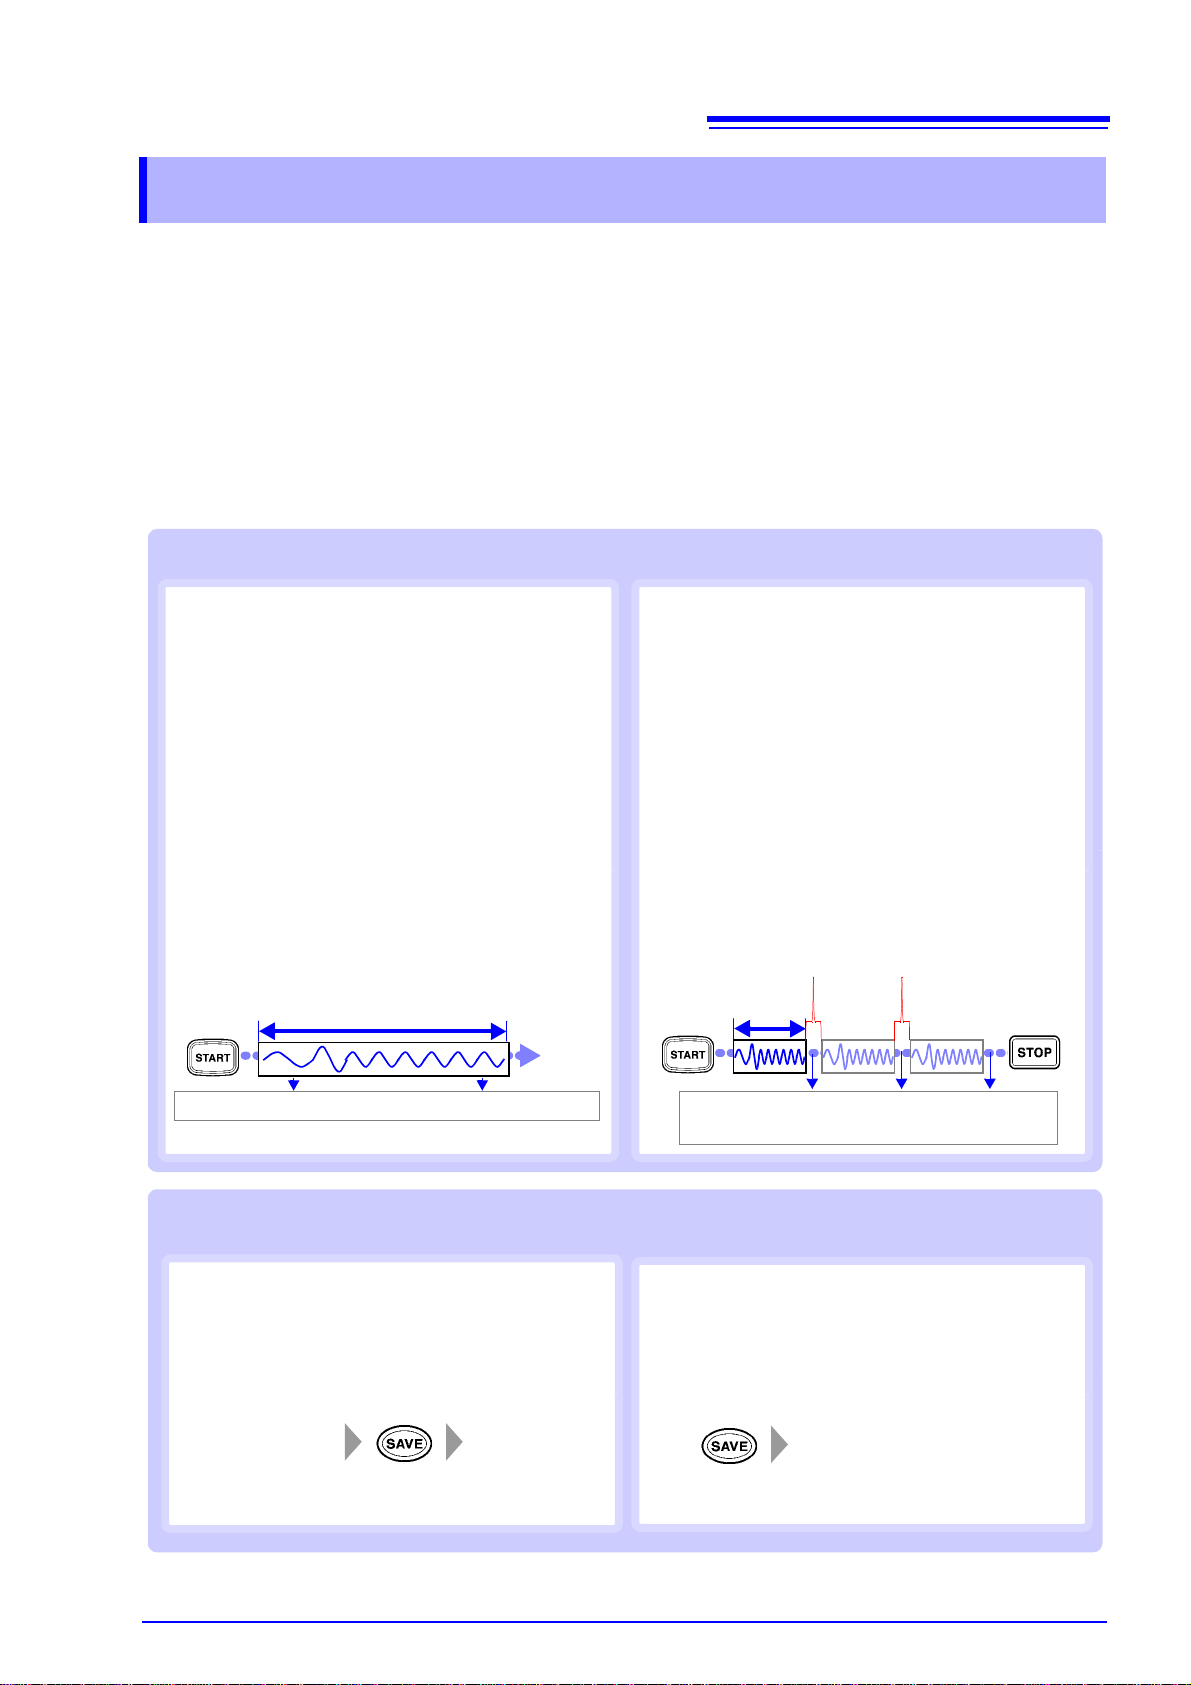
Performing measurement while saving data automatically
Real-time save
•The recording interval, recording time, and other
recording conditions are set before starting mea-
surement. (Unlike when using auto save, you will
not be able to select high-speed sampling.)
•Data is recorded directly to the SD memory card
while measurement is performed.
•Since data is recorded directly to the SD memory
card, it is possible to record data in excess of the
internal memory capacity.
Auto save
•The sampling speed (or time axis), recording
length, and other recording conditions are set
before starting measurement. Measurement can
be performed using high-speed sampling.
•Data equivalent to the set recording length is
acquired in the instrument’s internal memory and
then saved to the storage destination. Data can
be saved to an SD memory card or USB flash
drive or sent by e-mail or FTP.
•Since data is saved to the instrument’s internal
memory, it is not possible to record data in excess
of the internal memory capacity.
Recordinglength
(division)
Data is saved after being acquired to the
internal memory.
Dead time: Data is not recorded if the trigger is ap-
plied during this interval.
Recording time
Data is recorded directly to the SD memory card.
End
Saving data by pressing the SAVE key at any time after measurement
Set data to be
saved. Save data.
Quick save
Thedata to be saved is set in advance. Thenyou can
save that data immediately at any time by pressing
the SAVE key.
Selection save
The data to be saved is set after you press the SAVE
key. Then the data is saved.
Set thedata to be saved and save
the data.

Screen Organization and Operational Overview
8
Settings can be configured on setting windows on the Waveform screen or on the Settings screen.
Setting measurement conditions
Select the desired set-
ting from the [Time-
base] list.
Set the time per division on
the horizontal axis. Sampling
is fixed to 100 samples per
division. If you do not wish to
change the setting, tap the
current setting to re-select it.
To keep the current setting,
tap the setting again.
Select the desired set-
ting from the [Shot]
list.
Set the length (number of di-
visions) to record each time
data is acquired. If you do not
wish to change the setting,
tap the current setting to re-
select it.
Waveform screen ([Status] window)
"Configuring input channels" (p.9)
Open the screen.
[Waveform Display] [Status] [Basic]
or [Setting Display] [Status]
1
2
3
1
2
3
Arranging measurement results
The method used to display measurement data on the
Waveform screen can be changed to allow a maximum of
four sheets, with up to four segments per screen.
Related settings are configured on the [Display] window.

Screen Organization and Operational Overview
9
This explanation applies when using the MR8901 Analog Unit.
Configuring input channels
Waveform screen ([Channel] window)
[Analog] Select the channel to configure.
Set the [Range(/div)].
(Configure other settings as necessary.)
Setting to [Display] allowstheWaveformscreen
display to be changed. The screen can also be
changed after measurement.
Display [Detail] and configure input module-
specific settings as necessary.
"Configuring triggers (to assign specific conditions for
recording)" (p.10)
2
3
Configure these settings as necessary:
[Filter]
You can set the frequency band to cut (filter
band) if you wish to cut excessive high-fre-
quency components, for example when input
signal noise is a concern.
[Coupling]
The instrument is normally used in DC cou-
pling mode. The zero position can be
checked by setting the instrument to GND
mode.
Open the screen.
[Waveform Display] / [Setting Display]
[Channel]
1
4
3
4
2
To calculate and display input values
Set the display to [Scaling] and set the calculation method.
This functionality allows you to check converted measured
values. It can also be changed after measurement.
To change the waveform color or screen
display
Set the display to [Display] to change the waveform color,
display position, graph settings, display magnification, or
other settings. These settings can also be changed after
measurement.
1

Screen Organization and Operational Overview
10
Configuring triggers (to assign specific conditions for recording)
Waveform screen ([Trigger] window)
[General] Set [Trigger] to [On] and set the
trigger conditions.
Select [Analog] and set the trigger condi-
tions for each channel.
Channel Trigger type Level value at which to apply
trigger
TT
Level
Slope
T
T
T
T
Trigger types
In Out
Open the screen
[Waveform Display] / [Setting Display]
[Trigger]
1
2
3
1
2
[Trigger Mode]
•Single
Data is recorded once when the trigger
conditions are satisfied.
•Repeat
Data is recorded repeatedly when the trig-
ger conditions are satisfied.

Screen Organization and Operational Overview
11
Configuring auto save
Set [Auto Save] to
[On] and set the media
and filename.
Set [Waveform] to
[On].
Tapping the setting toggles it
on and off.
Waveform screen ([Status] window) Open the screen
[Waveform Display] [Status] [Auto
Save] Or [Setting Display] [Status]
[Auto Save Settings]
1
2
3
1
2
3
[Type]
•Binary
Saves waveform data in a binary format.
•Text
Saves waveform data in a text format.
[Method]
•Normal
Stops auto save operation when the media becomes full.
Save operation will stop, but measurement will continue.
•Delete
Old files are deleted so that data can continue to be
saved when the media becomes full.
Configure settings as necessary. For more information, see the instruction manual.
3. Starting and Stopping Measurement
Stop measurement
Trigger mode: [Single]
Data equivalent to the recording length is recorded once and saved to media.
Trigger mode: [Repeat]
Data equivalent to the recording length is recorded
repeatedly and saved to media.
(Trigger wait)
Stop measurement
(STOP key is pressed or the
set trigger conditions cause
measurement to stop.)
(Auto save)
Trigger conditions satisfied

Screen Organization and Operational Overview
12
This section provides a basic example of how measurement results are analyzed. For more information, see
the instrument’s instruction manual.
4. Analyzing Measurement Results
Scrolling waveforms
Scrollquicklytoward
the oldest data
Scroll toward older data Scroll toward newer data
Scroll quickly toward
the newest data
The waveform is scrolled each time you tap the window. Tap-
ping harder* causes the waveform to scroll faster. Tapping con-
tinuously causes the waveform to scroll continuously.
*Hard taps made with a touch pen cannot be detected.
Scrolling with the Arrow window
Waveforms can be scrolled by either using the Arrow window or tapping the scroll bar.
Displaying the desired location with the scroll
bar
Tap the desired location on the scroll bar.
Scroll bar
Overall waveform
Scope and position of
the waveform being dis-
played on the screen
Scroll bar Arrow window
Magnifying and compressing waveforms
Magnifying and compressing the horizontal
axis (time axis)
Selecting from the Waveform screen’s [Mag.] list
Waveforms for all channels are magnified and compressed along
the horizontal axis using the left edge of the screen as the refer-
ence. When cursors are being shown on the screen, waveforms
are magnified andcompressed usingthe cursor as the reference.

Screen Organization and Operational Overview
13
Magnifying and compressing the vertical axis
(voltage axis)
Waveform screen ([Channel] window)
1
Open the screen
[Waveform Display] / [Setting Display]
[Channel]
1
2[Analog] [Display] [Mag.]
Select from the list.
2
Viewing the value at the cursor and selecting a range
Select the cursor
to move.
To moveat the same time,
select [Sync].
Move the cursor(s).
:
Light tap Moves 1 data point at a
time.
Hard tap*Moves 5 data points at a
time.
:
Light tap Moves 1 division at a
time.
Hard tap*Moves 5 divisions at a
time.
Touching continuously causes the
waveform to scroll continuously.
*Hard taps made with a touch pen
cannot be detected.
Open the screen.
[Waveform Display] [Cursor]
1
2
1
2 3
Select the cursor you wish to display.
A to D: Trace cursor
E, F: Horizontal cursor
To specify a range, select A-B or C-D.
Tapping toggles between [Show Value] and
[Hide Value].
Setting to [Show Value] causes the Measured
Value window to be displayed.
To hide the Measured Value window, tap [Hide
Value].
1

Screen Organization and Operational Overview
14
You can either change the waveform zoom setting and zero position or assign waveforms to sheets or
graphs. This section describes how to improve waveform visibility by changing the waveform zoom setting
and zero position.
If the display is hard to decipher due to overlapping waveforms
Zoom setting: x1 x1/2 Zero position: 50%
100%
0%
50%
Changing the waveform zoom
setting (vertical axis)
0 V
25%
0 V
25%
Changing the waveform zero
position
Assigning waveforms to graphs
Normal Display graphs
Gr1
Gr2
Gr3
Gr4
Waveform screen ([Channel] window)
1
2
[Analog] Select the channel to configure.
2
Open the screen.
[Waveform Display] / [Setting Display]
[Channel]
1
Set the display to [Display] and change the
settings.
• Change the zoom: [Mag.] Select from the list.
• Change the zero position: [Position] Change
the value.
3
(Example settings)
Assigning waveforms to sheets
• These settings can be changed during measurement.
• You can also select the logic waveform position.
• When the waveform includes a DC component, chang-
ing the zoom setting has the effect of making the wave-
form appear to fluctuate significantly. This is due to the
fact that the zoom setting also affects the DC compo-
nent.
S1 S2 S3 S4

Screen Organization and Operational Overview
15
Performing calculations
There are 24 types of numerical calculations available, up to 8 of which can be performed at the same
time. There are two methods for performing calculations:
• Calculating while measuring (The numerical calculation must be configured before measurement.)
• Calculating using existing data (Calculations can be performed using data that has already been
acquired and data stored on media.)
This section describes how to perform calculations while measuring.
Set [Numeric Calculation] to [On] and con-
figure the calculation.
Available calculations
•Average
•RMS (Root-Mean-Square)
•P-P
•Maximum
•Time to Maximum
•Minimum
•Time to Minimum
•Period
•Frequency
•Rise Time
•Fall Time
•Standard Deviation
•Area
•X-Y Area
•Time to Level
•Level at Time
•Pulse Width
•Duty Ratio
•Pulse Count
•Arithmetic Operation
•Time Difference
•Phase Contrast
•High Level
•Low Level
(Total of 24 types)
•Specified calculation between
cursors
Waveform calculations can be lim-
ited to data within the range speci-
fied by A/B cursors and C/D
cursors.
For more information about cal-
culation equations and opera-
tors, see the instruction manual.
Open the screen.
[Setting Display] [Calculation]
[Numeric Calculation]
1
2
You can set the calculation type, calculation range, calcula-
tion target channel, and whether there is a judgment result.
You can switch the calcu-
lation configuration list.
You can configure calcula-
tion operation based on
judgment results.
The calculation will be performed automatically once mea-
surement starts. To perform a calculation using existing
data, select [Execute].
[Waveform Display] Open the [Numeric
Calc.] window and view the calculation
results.
3
1
Setting screen ([Numeric Calculation] window)
Waveform screen ([Numeric Calc.] window)
2

Viewing the Contents of Media
16
You can check data that has been saved with the instrument using the File screen.
Data that can be saved and loaded by the instrument
: Available / −: Not Available
Viewing the Contents of Media
Tap the media you wish to view to select it.
(The selected media will be displayed in reverse video.)
Open the screen.
[Setting Display] [File] [Operation]
1
2
3Tap the media again.
The data stored on the media will be displayed.
Tap here to move up a level.
1
File type File format Icon File extension Saving Loading
Auto Real-time Manual Instrument PC
Settings data*1 Binary SET −− −
Waveform data*2 Binary MEM −*5
Text*3 CSV −−
TXT
Numerical
calculation results Text*3 CSV −−
TXT
Display images BMP*4 BMP −−
*1: You can load settings data automatically when the instrument is turned on (auto setup function).
*2: Save data you wish to load later using the instrument in binary format. Waveform data will be saved along with some of
the settings data that was in effect at the time of measurement. To load data for later viewing on a PC, save it in text
format. To save a partial waveform, set the desired range with the A/B and C/D cursors. (p.13)
*3: When [Separator] is set to a value other than a comma, the file will have the .TXT extension.
*4: BMP is a standard Windows graphic format that can be opened and processed using many graphic applications.
*5: This format can be loaded using the Waveform Viewer (Wv).
For more information, see the instrument manual.

Viewing the Contents of Media
17
Folder and file structure
When data is saved, the folder “HIOKI_MR8875” will be created on the media, and folders will be saved inside
that folder.
For more information about filenames, see the instruction manual.
HIOKI_MR8875
Folder for storing settings data
CONFIG
Folder for storing waveform data
(Once the number of files in a folder exceeds 1,000, a new folder will be automatically created with an
updated number.)
DATA000 to 999
MEASUREMENT
PICTURE
Folder for storing numerical calculation results
Folder for storing display images
Waveform data
Settings data
Numerical calculation results
Display images
TEMP
Folder for storing temporary waveform data files when using real-time save operation
Waveform data (temporary files)
INTERNAL_CONFIG
Folder for storing data describing setting conditions saved in the instrument’s memory
Settings data
(setting conditions saved in the instrument’s memory)

Convenient Functionality
18
Convenient Functionality
When you don’t know the time axis
or range
“Auto-ranging”
Automatically sets the time axis range, voltage axis
range, and zero position.
[Waveform Display (page2/2)]
[Auto Range] [Yes]
When you wish to record evidence or
passage of abnormal phenomena
“Pre-trigger” and “Post-trigger”
Allows you to record the waveform prior to the trig-
ger point or conditions after the trigger point. This
functionality is useful when you wish to assess
trends such as abnormal phenomena.
[Waveform Display] / [Setting Display]
[Trigger] [General] [Pre-Trigger] /
[Post-Trigger]
Display items vary with the trigger timing, percent
setting, and division setting.
When you wish to convert readings to
strain, temperature, or other values
“Scaling”
[Waveform Display] / [Setting Display]
[Channel] [Analog] [Scaling]
Sets the conversion method.
Without pre-trigger
setting With pre-trigger setting
AV
When you wish to change the wave-
form position or display range
[Waveform Display]/[Setting Display]
[Channel][Display][Position]/[Variable]
“Position“
(specify the waveform zero position)
When you wish to assign measure-
ment results to display sheets and
graphs
[Waveform Display]/[Setting Display]
[Channel][Analog][Display][Sheet]/
[Graph]
ALL
S2
S1
When you wish to monitor waveforms
“Numeric monitor” and
“Waveform monitor”
[Waveform Display] [Numeric Monitor] /
[Waveform Monitor]
Allows you to monitor current waveform and value
input.
50
-50 -50
50
TT
“Variable“
(specify with upper and lower limits)
Table of contents
Other Hioki Measuring Instrument manuals
Popular Measuring Instrument manuals by other brands

Martin Lishman
Martin Lishman Grainmaster i2-S instruction manual

Michell Instruments
Michell Instruments Easidew Portable HP user manual

Fluidwell
Fluidwell F043-T manual

Casella
Casella HB4056-01 dBadge2 user manual

Thermo Scientific
Thermo Scientific Eutech EC 1720 user manual

Conrad
Conrad 75 15 82 operating instructions