OPERATION
PRELIMINARYOPERATION
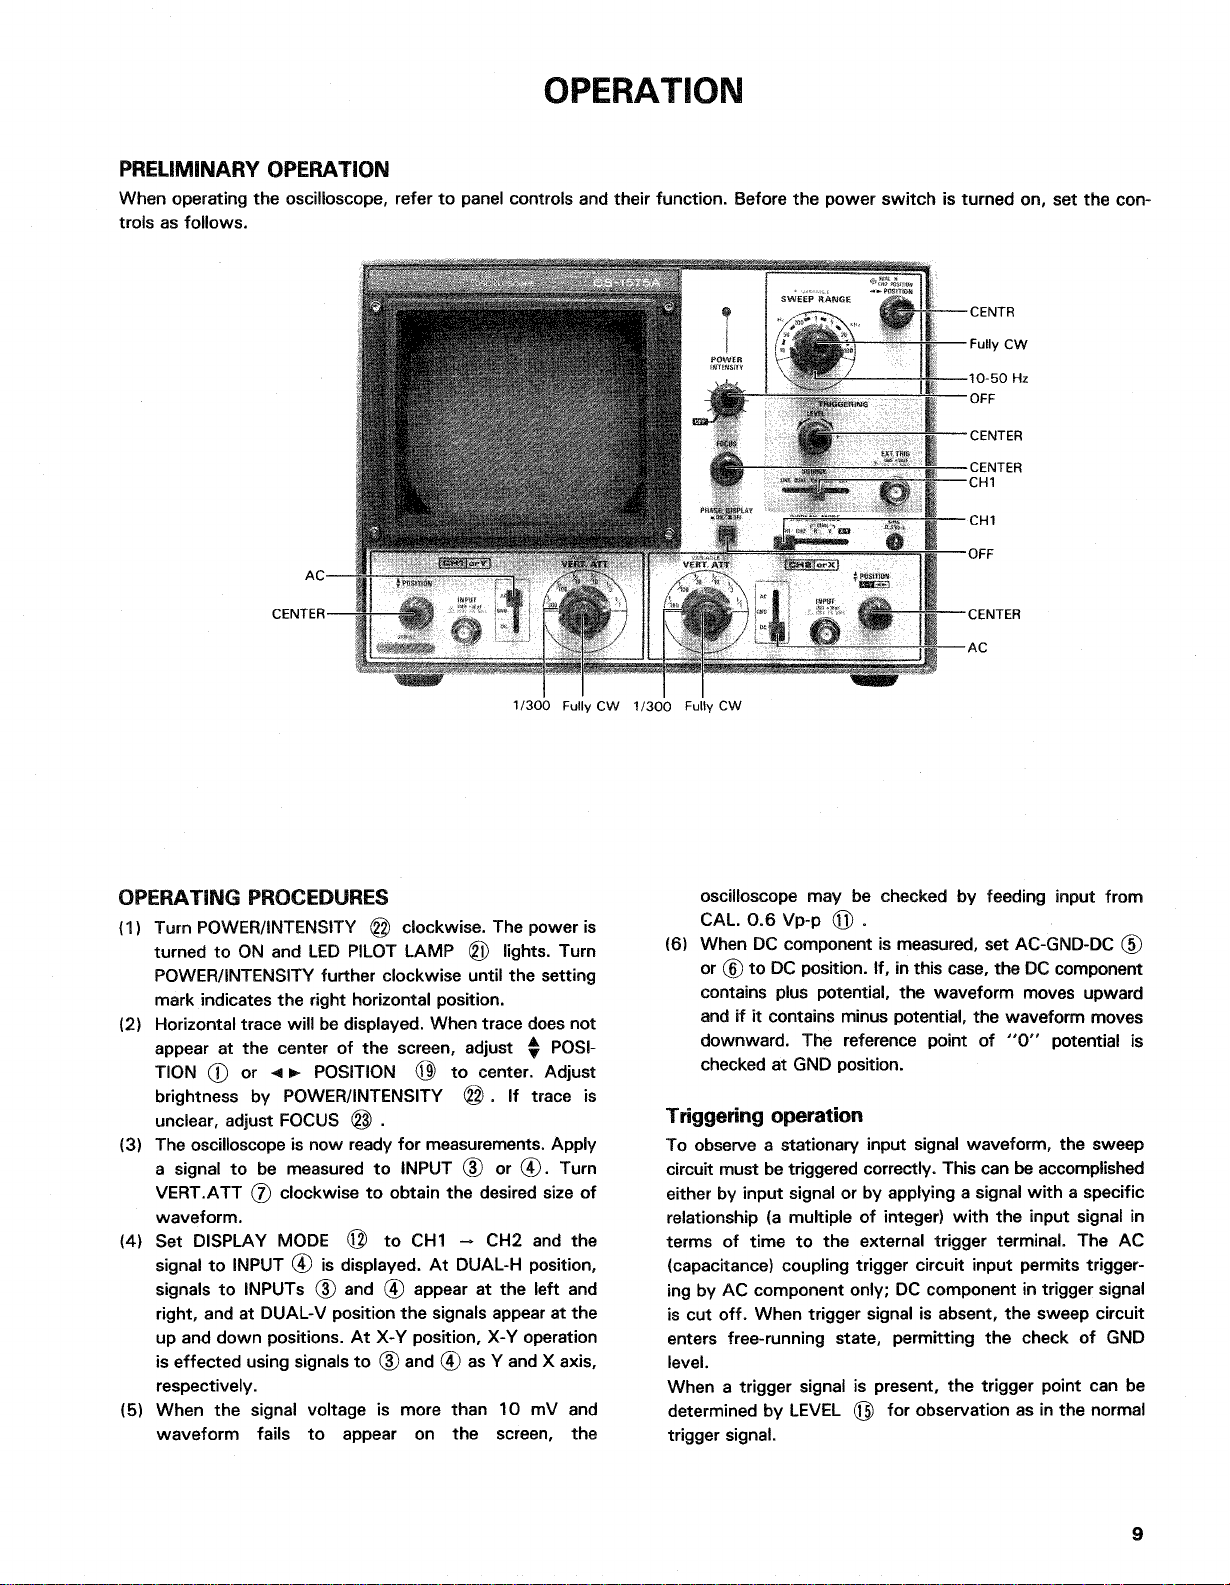
When
operatingtheoscilloscope,refertopanelcontrolsandtheirfunction.Beforethepowerswitchisturnedon,setthecon-
trols
asfollows.
OPERATING
PROCEDURES
(1)
TurnPOWER/INTENSITY
@
clockwise.Thepoweris
turned
toON
andLEDPILOTLAMP
©
lights.Turn
POWER/INTENSITYfurtherclockwiseuntilthesetting
mark.indicates
therighthorizontalposition.
121
Horizontaltrace
will
bedisplayed.
When
tracedoesnot
appear
at
thecenter
of
thescreen,adjust
%
POSI-
TION
® or< •
POSITION
© to
center.Adjust
brightness
by
POWER/iNTENSlTY
© . If
trace
is
unclear,
adjustFOCUS
@ .
(3)
Theoscilloscopeisnowreadyformeasurements.Apply
a
signal
tobe
measured
to
INPUT
(3)or®.
Turn
VERT.ATT
(J)
clockwise
to
obtainthedesiredsize
of
waveform.
(4)
Set
DISPLAY
MODE
@ to
CH1
- CH2andthe
signal
to
INPUT
®
isdisplayed.
At
DUAL-Hposition,
signals
to
INPUTs(3)and
®
appear
at
theleftand
right,andatDUAL-Vpositionthesignalsappearatthe
upanddownpositions.AtX-Yposition,X-Yoperation
is
effectedusingsignalsto
®
and
®
as
Y
and
X
axis,
respectively.
15)
When
the
signalvoltage
is
more.than
10mVand
waveform
fails
to
appear
onthe
screen,
the
oscilloscope
maybe
checked
by
feedinginputfrom
CAL
0.6Vp-p
© . •
(6)
When
DC
componentismeasured,set
AC-GND-DC
©
or
©
toDCposition.If,inthis
case,
theDCcomponent
contains
pluspotential,thewaveformmovesupward
and
ifit
containsminuspotential,thewaveformmoves
downward.
The
referencepoint
of"0"
potential
is
checked
atGNDposition.
Triggering
operation
Toobservea:stationaryinputsignalwaveform,thesweep
circuit
mustbetriggeredcorrectly.Thiscanbeaccomplished
either
by
inputsignal
orby
applying
a
signalwith
a
specific
relationship
(a
multiple
of
integer)withtheinputsignal
in
terms
of
time
tothe
externaltriggerterminal.The
AC
(capacitance)
couplingtriggercircuitinputpermitstrigger-
ing
by
ACcomponentonly;
DC
componentintriggersignal
is
cutoff.
When
triggersignalisabsent,thesweepcircuit
enters
free-runningstate,permitting
the
check
ofGND
level.
When
a
triggersignal
is
present,thetriggerpointcan
be
determined
by
LEVEL
©
forobservationasinthenormal
triggersignal.
9