S&C IntelliCap Instruction Manual

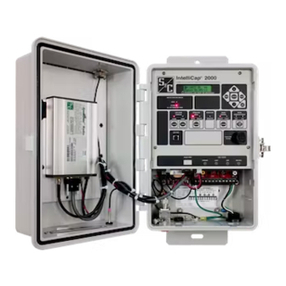
S&C IntelliCap®Automatic Capacitor Control
Instruction Sheet 1022-540
© S&C Electric Company 2003-2017, all rights reserved
December 4, 2017
Operation
Table of Contents
Section Page Section Page
Introduction
Qualified Persons ..............................2
Read this Instruction Sheet ......................2
Retain this Instruction Sheet......................2
Proper Application..............................2
Special Warranty Provisions ......................2
Safety Information
Understanding Safety-Alert Messages ..............4
Following Safety Instructions .....................4
Replacement Instructions and Labels ..............4
Safety Precautions........................... 5
Hardware and Software
Faceplate Features .............................6
Faceplate LCD Screen ..........................6
Control Software ...............................7
IntelliLink®Setup Software .......................8
IntelliCap Control Operation
Signal Processing ........................... 9
Automatic Operation ......................... 9
Viewing Data Logging
Daily Statistics for the Last Month.................15
Sensor Profiles ...............................16
Switching Level Data...........................18
Event Logs ..................................19
Data Graphing. . . . . . . . . . . . . . . . . . . . . . . . . . . . . . . . 20
Generating Reports ......................... 22
Saving and Logging a Setup Configuration .... 23
Using Virtual Memory Files .................. 24
Updating Control Software................... 25
Running Setup Software from DOS ........... 26

2 S&C Instruction Sheet 1022-540
Introduction
WARNING
The equipment covered by this publication must be installed, operated, and
maintained by qualified persons who are knowledgeable in the installation, operation, and
maintenance of overhead electric power distribution equipment along with the
associated hazards.
A qualified person is one who is trained and competent in:
• The skills and techniques necessary to distinguish exposed live parts from nonlive
parts of electrical equipment
• The skills and techniques necessary to determine the proper approach distances
corresponding to the voltages to which the qualified person will be exposed
• The proper use of the special precautionary techniques, personal protective
equipment, insulating and shielding materials, and insulated tools for working on or
near exposed energized parts of electrical equipment
These instructions are intended only for such qualified persons. They are not intended
to be a substitute for adequate training and experience in safety procedures for this
type of equipment.
NOTICE
Read this instruction sheet thoroughly and carefully before installing or operating
your S&C IntelliCap Automatic Capacitor Control. Familiarize yourself with the Safety
Information on page 4 and Safety Precautions on page 5. The latest version of this
publication is available online in PDF format at sandc.com/en/support/
product-literature/.
This instruction sheet is a permanent part of your S&C IntelliCap Automatic Capacitor
Control. Designate a location where you can easily retrieve and refer to this publication.
WARNING
The equipment in this publication must be selected for a specific application.
The application must be within the ratings furnished for the selected equipment.
The standard warranty contained in S&C’s standard conditions of sale, as set forth in Price
Sheets 150 and 181, applies to the S&C IntelliCap Automatic Capacitor Control, except that
the rst paragraph of the said warranty is replaced by the following:
(1) General: The seller warrants to the immediate purchaser or end user for a period of
10 years from the date of shipment that the equipment delivered will be of the kind and
quality specified in the contract description and will be free of defects of workmanship and
material. Should any failure to conform to this warranty appear under proper and normal
use within 10 years after the date of shipment, the seller agrees, upon prompt notification
thereof and confirmation that the equipment has been stored, installed, operated, inspected,
and maintained in accordance with the recommendations of the seller and standard industry
practice, to correct the nonconformity either by repairing any damaged or defective parts
of the equipment or (at the seller’s option) by shipment of necessary replacement parts. The
seller’s warranty does not apply to any equipment that has been disassembled, repaired, or
altered by anyone other than the seller. This limited warranty is granted only to the immedi-
ate purchaser or, if the equipment is purchased by a third party for installation in third-party
equipment, the end user of the equipment. The seller’s duty to perform under any warranty
may be delayed, at the seller’s sole option, until the seller has been paid in full for all goods
purchased by the immediate purchaser. No such delay shall extend the warranty period.
Replacement parts provided by the seller or repairs performed by the seller under the
warranty for the original equipment will be covered by the above special warranty provi-
sion for its duration. Replacement parts purchased separately will be covered by the above
special warranty provision.
Qualified Persons
Read this
Instruction Sheet
Retain this
Instruction Sheet
Proper Application
Special Warranty
Provisions

S&C Instruction Sheet 1022-540 3
Introduction
Warranty of the S&C IntelliCap Automatic Capacitor Control is contingent upon the
installation, configuration, and use of the control or software in accordance with S&C’s
applicable instruction sheets.
This warranty does not apply to major components not of S&C manufacture. However,
S&C will assign to the immediate purchaser or end user all manufacturer’s warranties that
apply to such major components.
Warranty of equipment/services packages is contingent upon receipt of adequate informa-
tion on the user’s distribution system, sufficiently detailed to prepare a technical analysis.
The seller is not liable if an act of nature or parties beyond S&C’s control negatively impact
performance of equipment/services packages; for example, new construction that impedes
radio communication, or changes to the distribution system that impact protection systems,
available fault currents, or system-loading characteristics.

4 S&C Instruction Sheet 1022-540
Safety Information
Understanding
Safety-Alert Messages
Following
Safety Instructions
Replacement
Instructions and
Labels
Several types of safety-alert messages may appear throughout this instruction sheet and
on labels attached to the S&C IntelliCap Automatic Capacitor Control. Familiarize yourself
with these types of messages and the importance of these various signal words:
DANGER
“DANGER” identifies the most serious and immediate hazards that will likely result in
serious personal injury or death if instructions, including recommended precautions,
are not followed.
WARNING
“WARNING” identifies hazards or unsafe practices that can result in serious personal
injury or death if instructions, including recommended precautions, are not followed.
CAUTION
“CAUTION” identifies hazards or unsafe practices that can result in minor personal
injury if instructions, including recommended precautions, are not followed.
NOTICE
“NOTICE”identifies important procedures or requirements that can result in product or
property damage if instructions are not followed.
If you do not understand any portion of this instruction sheet and need assistance,
contact your nearest S&C Sales Office or S&C Authorized Distributor. Their tele-
phone numbers are listed on S&C’s website sandc.com, or call S&C Headquarters
at (773) 338-1000; in Canada, call S&C Electric Canada Ltd. at (416) 249-9171.
NOTICE
Read this instruction sheet thoroughly and
carefully before installing or operating your S&C
IntelliCap Automatic Capacitor Control.
If you need additional copies of this instruction sheet, contact your nearest S&C Sales Ofce,
S&C Authorized Distributor, S&C Headquarters, or S&C Electric Canada Ltd.
It is important that any missing, damaged, or faded labels on the equipment be replaced
immediately. Replacement labels are available by contacting your nearest S&C Sales Office,
S&C Authorized Distributor, S&C Headquarters, or S&C Electric Canada Ltd.

S&C Instruction Sheet 1022-540 5
Safety Precautions
DANGER
The S&C IntelliCap Automatic Capacitor Control line voltage input range is 93 to 276
Vac. Failure to observe the precautions below will result in serious personal injury
or death.
Some of these precautions may differ from your company’s operating procedures and
rules. Where a discrepancy exists, follow your company’s operating procedures and rules.
1. QUALIFIED PERSONS.Access to the IntelliCap
Automatic Capacitor Control must be restricted only to
Qualified Persons.
2. SAFETY PROCEDURES. Always follow safe operating
procedures and rules. Always maintain proper clearance
from energized components.
3. PERSONAL PROTECTIVE EQUIPMENT. Always
use suitable protective equipment, such as rubber
gloves, rubber mats, hard hats, safety glasses, arc-flash
clothing,andfallprotection, inaccordancewith safe operating
procedures and rules.
4. SAFETY LABELS AND TAGS. Do not remove or
obscure any of the “DANGER,” “WARNING,” “CAUTION,” or
“NOTICE” labels and tags. Remove tags ONLY if instructed
to do so.
5. MAINTAINING PROPER CLEARANCE.Always
maintain proper clearance from energized components.

6 S&C Instruction Sheet 1022-540
Hardware and Software
This section explains how the control components monitor the distribution feeder and
manage capacitor bank operation.
The faceplate LCD screen and switches are shown in Figure 1.
Faceplate Features AUTO/MANUAL switch—Toggle this switch up to enable Automatic control operation
and block commands from the faceplate CLOSE/OPEN switch. Toggle this switch down to
disable Automatic operation.
CLOSE/OPEN switch—Toggle this switch up to send a Close command to the capacitor
bank switch. Toggle this switch down to send an Open command to the bank switch.
Note: When the AUTO/MANUAL switch is in the Auto position, toggling the CLOSE/OPEN
switch has no effect.
SELECT SETPOINT switch—Toggle this switch up or down to scroll through setpoint
parameters on the LCD screen.
CHANGE SETPOINT switch—Toggle this switch up or down to change selected setpoint.
Note: When the Faceplate Setpoints Adjustment setpoint on the Setup>Miscellaneous
screen is set to the Protected state or the AUTO/MANUAL switch is in the Auto mode,
toggling the CHANGE SETPOINT switch has no effect. When the Faceplate Setpoints
Adjustment setpoint is set to the Protected mode, use of a computer with IntelliLink®
software is required to change the settings.
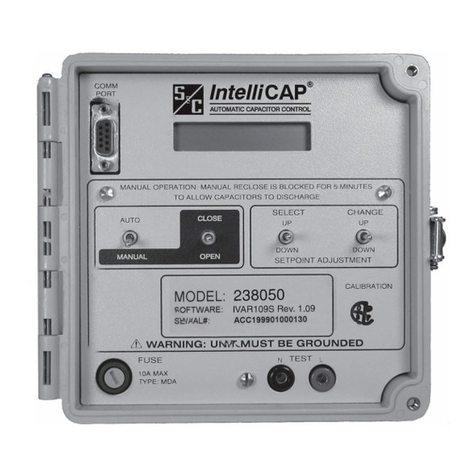
Figure 1. The IntelliCap Control faceplate.
LCD screen
Local comm port
Switches
Test points
10-A load fuse
Faceplate LCD Screen The control has a 16-character LCD screen that cycles through the list of real-time data,
operating information, logged data, and setpoints. Other operating information, such as a
temperature sensor error or a manual operation delay, are also displayed. When the LCD
screen is cycling automatically, only setpoints for the presently active control strategy are
shown. If the setpoints are scrolled with a faceplate command, the LCD screen shows all
available setpoints. Table 1 on page 7 lists the real-time data, operating information, and
logged data that appears on the LCD screen.
Note: Because of rounding differences, the IntelliLink software screens and the LCD screen
may display slightly different values for the real-time data and setpoints.

S&C Instruction Sheet 1022-540 7
Hardware and Software
Table 1. Data Displayed on the LCD Screen
Display Meaning
Date, time Present time and date
[Volt];[Ovr] Line voltage (true RMS measured voltage); whether a voltage override is in effect
[Line kV] Primary voltage (var control only)
[Line Amps] Primary current (var control only)
[PF];[Dir] Power factor; normal or reversed power-flow direction (var control only)
[Line kVAR] Line kvar level (var control only)
[Line kW] Line kW level (var control only)
[Line kVA] Line kVA level (var control only)
[Temperature] Present ambient temperature
[Stat] Closed/open status of the capacitor bank
[Evnt] Active event; if no event is active, the display reads **None/Unit OK**
[OperMode] The present operating mode of the IntelliCAP (hardware manual, software
manual, or automatic)
[AUTO] The automatic control strategy for the present season
[SoftVer] The ID of the control software in the IntelliCap control
[OperCount] Total number of complete switching cycles since installation
[SwIn] The reason for the last switch in
[SwOut] The reason for the last switch out
Table 2 shows other possible operational information displayed, in order of precedence:
Table 2. Other Operating Information Displayed on the LCD Screen
Display Meaning
[Faceplate Sw.Err] Indicates a problem with one of the faceplate switches
[Voltage Sen Err] Indicates the voltage sensor is reading outside its valid range or is faulty
[Temperat Sen Err] Indicates the temperature sensor is reading outside its valid range or is faulty
[HiLoVoltBand Err] Indicates the Bank Voltage Change + Margin setpoint is greater than the
difference between the High Voltage Override setpoint and the Low Voltage
Override setpoint
[Close In ## secs] Indicates the number of seconds left until the control operates the bank
[Open In ## secs] Indicates the number of seconds left until the control operates the bank
[Reclose Block] Displays when trying to close the bank while the reclose block delay is in effect
See Instruction Sheet 1022-550, “S&C IntelliCap®Automatic Capacitor Control:
Troubleshooting,” for more information about correcting errors.
Control Software S&C control operation is software-driven. IntelliCap controls include factory-installed
control software. IntelliLink Setup Software must be installed on the computer used with
the control.
The control software manages minute-by-minute functioning of the IntelliCap control.
It continually monitors:
• Voltage on the feeder
• The position of faceplate switches
• Ambient air temperature at the control
• The control clock and calendar
• Software setpoint values
• Various other setpoints and data values
Based on this information, the control software decides how to respond to a change in
voltage, a faceplate command, and other conditions. The control software, setpoint values,
and historical data are stored in non-volatile memory that will survive a power interruption.

8 S&C Instruction Sheet 1022-540
Hardware and Software
IntelliLink Setup Software is used to communicate with the control at the capacitor-bank
site. IntelliLink software enables:
• Entering installation-dependent operating parameters (setpoints), such as a physical
location, the temperature-change time threshold, the voltage override level, etc.
• Monitoring real-time data, such as present line voltage
• Examining the performance and operating history of an installed control
• Exporting conguration, operating, and historical data from the control to a report le
on a computer
• Downloading new control software into the IntelliCap control
• Troubleshooting installation problems
The IntelliCap control reports voltage, current, and phase-related data in units of volts,
amps, kvars, kW, and kVA. The rated accuracy of these measurements (±0.3% of full scale)
is based on the combined accuracy of all control components, exclusive of the sensor and
sensor cable, but including all sensor conditioning components.
Voltage readings are accurate for all distribution voltages. For IntelliCap with Var
controls, phase-angle detection requires a minimum current of 0.5% of full-scale values.
Current magnitudes are still detected and displayed below the 0.5% threshold. The control
uses the phase-angle offset values to correct all ac waveform data sampled from the line
sensor.
IntelliLink®Setup
Software

S&C Instruction Sheet 1022-540 9
Signal Processing
Automatic Operation
RMS Ac Waveform Analysis
The control uses true RMS detectors, with accuracy to the 100th 60-Hz harmonic, to produce
RMS data for voltage and current (if applicable) waveforms.
For real-time steady-state monitoring and data logging, the control collects data at
0.2-second intervals and averages eight samples to report a 1.6-second averaged value. This
results in a net response time of 1.6 seconds.
The control uses the 1.6-second averaged values for real-time display on the
faceplate LCD screen and most data logging. Reported daily-high and daily-low values are
the raw sample (unaveraged) values; they are saved for the present day and the preceding
31 days.
The 1.6-second averaged values are used to create interval averaged values (data
averaged over the logging interval) for voltage, temperature, current, kvars, power factor, and
kW, if applicable. Select a data-logging interval of 1, 5, 10, 15, 30, or 60 minutes. The period of
logged interval averaged values depends on the configured interval. See Table 3 on page 18.
Phase Angle Measurements
The IntelliCap with Var control uses a highly accurate, proprietary zero-crossing detection
scheme that is not tricked by multiple zero-crossings of noisy or harmonic-contaminated
signals to measure the phase angle between the voltage and current waveforms. Phase- angle
measurements have a 0 to 360-degree range.
The Installation Phase Offset setpoint compensates for various installation-dependent
phase-angle errors.
The control automatically switches the bank using a variety of control strategies:
Temperature, Timeclock, Voltage Only, Time-Biased Voltage, Time-Biased Temperature,
Automatic Online, or Automatic Ofine. The IntelliCap with Var control has two additional
control strategies: Current and Var.
The control switches the bank based on a prioritized set of conditions. From highest to
lowest priority, these are:
Five-minute reclose delay—After opening the bank, the control will not close it for
5 minutes. This allows the capacitors to discharge. The Reclose Delay Block eld on the
Operation screen shows the time remaining before the control can close the bank.
State of the faceplate switches—When the AUTO/MANUAL switch is set to Manual
mode, the control blocks automatic operation of the bank. The CLOSE/OPEN faceplate
switch is the only way to operate the bank.
Manual software commands—When the SOFTWARE CONTROL SETTINGS: Manual
Operation eld displays the Enabled state, the control accepts Close and Open commands
from IntelliLink Setup Software.
The anti-cycling limit—When the control is in Automatic mode, the Maximum
Automatic Control Cycles Per Day setpoint on the Setup>Miscellaneous screen
determines the maximum number of automatic switching cycles per calendar day. When
this limit is reached, the capacitor bank remains switched out until the next calendar day.
The High- and Low-Voltage Override setpoints—If the voltage remains outside the
normal range for the specied time period, the control switches the bank.
The present control strategy—The control switches the bank according to the control
strategy in effect.
If the control was in Manual mode and is returned to Automatic mode, it waits
60 seconds before switching the bank to allow the operator to step away from the bank.
IntelliCap Control Operation

10 S&C Instruction Sheet 1022-540
Timeclock Control Mode
When Automatic mode is enabled and the control is congured for Timeclock mode, the
control switches the bank based on a time schedule. Two different time schedules can be
congured, and the control uses the following logic to determine when to switch the bank:
(a) The control checks to see whether the present time is in one of the scheduled On
periods.
(b) If the present time is within a scheduled On period and the calendar day is not a
holiday, the control closes the bank switch. If the bank is already switched in, it
remains switched in.
(c) When the time is no longer in a scheduled On period or the calendar day becomes
a holiday, the control switches the bank out. If the bank is already switched out, it
remains switched out.
Note: The voltage level must remain in a range where switching the bank will not cause a
voltage-override condition. Otherwise, the control will not switch the bank.
Temperature Control Mode
When Automatic mode is enabled and Temperature mode is active, the control switches
the bank based on the present air temperature. The control can operate in both High- and
Low-Temperature modes and uses the following logic to determine when to switch the bank:
(a) The control monitors air temperature.
(b) When the temperature passes the Temperature at Which Bank Switches In or
Temperature at Which Bank Switches Out setpoint, the Temperature
Change Time Threshold timer starts.
(c) For high-temperature operation, if the temperature remains continuously above
the Temperature at Which Bank Switches In setpoint for the duration of the
timer, the control switches the bank in. If it remains below the Temperature at
Which Bank Switches Out setpoint for the duration of the timer, the control
switches the bank out.
(d) For low-temperature operation, if the temperature remains continuously below
the Temperature at Which Bank Switches In setpoint for the duration of the
timer, the control switches the bank in. If it remains above the Temperature at
Which Bank Switches Out setpoint for the duration of the timer, the control
switches the bank out.
Note: Voltage must remain in a range where switching the bank will not cause a Voltage-
Override condition. Otherwise, the bank will not switch.
Voltage Only Control Mode
When Automatic mode is enabled and the control is in Voltage Only mode,the control
switches the bank based only on the High- and Low-Voltage Override setpoints. A preferred
capacitor bank position can also be congured. Figures 2 and 3 on page 11 and Figure 4 on
page 12 show when the capacitor bank switches for each setting of the Preferred Capacitor
Bank Position setpoint. The control uses the Voltage Override setpoint and the Bank
Voltage Change + Margin setpoint to avoid excess cycling.
The following logic is used to determine when to switch the bank:
(a) The control monitors the voltage level. When the level stays within the normal
range, the control switches the bank based on the Preferred Capacitor Bank
Position setpoint on the Setup>Control Strategy-Voltage Only screen. No action
is taken if the Don’t Care mode is selected or if switching the bank would cause a
Voltage-Override condition.
(b) When the voltage level passes the High-Voltage Override setpoint or the Low-
Voltage Override setpoint, the Over-Voltage Override-Time Threshold or the
Under-Voltage Override-Time Threshold timer starts.
IntelliCap Control Operation
S&C Instruction Sheet 1022-540 11
(c) If voltage remains continuously above the High-Voltage Override setpoint for the
duration of the Over-Voltage Override-Time timer, the control switches the
bank out. If voltage remains continuously below the Low-Voltage Override
setpoint for the duration of the Under-Voltage Override-Time timer, the control
switches the bank in.
Time-Biased Voltage Control Mode
When Automatic mode is enabled and the control is in Time-Biased Voltage mode, the
control switches the bank based on two sets of High- and Low-Voltage setpoints. Time-
Biased Voltage mode uses the same logic as Voltage Only mode, except:
• The voltage setpoints are different for scheduled and unscheduled times.
• There is only one Voltage-Change Time-Threshold timer.
• The control does not use the Preferred Capacitor Bank Position setpoint.
Figure 2. Voltage control switching with no preferred-bank position selected.
Figure 3. Voltage control switching with the preferred-bank position in Online mode.
IntelliCap Control Operation
12 S&C Instruction Sheet 1022-540
Figure 4. Voltage control switching with the preferred-bank position in Offline mode.
IntelliCap Control Operation
Time-Biased Temperature Control Mode
When Automatic operation is enabled and the control is in Time-Biased Temperature
mode, the control switches the bank based on two sets of temperature setpoints. Time-
Biased Temperature mode uses the same logic as Temperature mode, except:
• There is only one set of temperature setpoints in use per season.
• The bank is ofine during unscheduled times.
Note: If the bank is online when the unscheduled period begins and the temperature
does not go beyond the Switch-Out value, the bank switches back in at the start of the
next scheduled period. It does not wait for the temperature to go beyond the Switch-In
setpoint. For example, the bank is set to switch in at 80°F and switch out at 70°F. The
timeclock scheduled period is 8:00–17:00. On Monday at 17:00, the bank switches out.
During the unscheduled time, the temperature does not go below 70°F for the length of the
Temperature Time Threshold setpoint. On Tuesday at 8:00, the bank switches in again,
even if the temperature is below 80°F.
Note: The voltage must remain in a range where switching the bank will not cause a voltage-
override condition. Otherwise, the bank will not switch to avoid excess cycling.
Automatic Online Control Mode
When Automatic mode is enabled and the control is in Automatic Online mode, the bank
is always switched in. The control does not even switch the bank for a Voltage-Override
condition.
If the bank is switched offline in Manual mode, the control switches it back online when
it returns to Automatic mode (after the reclose-delay block).
Automatic Offline Control Mode
When Automatic mode is enabled and the control is in Automatic Ofine mode, the bank
is always switched out. The control does not even switch the bank for a voltage-override
condition.
If the bank is switched online in Manual mode, the control switches it back offline when
it returns to Automatic mode after the 60-second delay.

S&C Instruction Sheet 1022-540 13
Current Control Mode (IntelliCap with Var only)
When Automatic mode is enabled and the control is in Current mode, the control switches
the bank based on measured single-phase current ow and uses the following logic to
determine when to switch the bank:
(a) The control monitors single-phase line current.
(b) When the control senses the current has passed the Single-Phase Current at
Which Bank Switches In or Single-Phase Current at Which Bank Switches
Out setpoint, it starts the Current Change Time Threshold timer.
(c) When the single-phase current remains continuously above the Single-Phase
Current at Which Bank Switches In setpoint for the duration of the timer, the
control switches the bank in. When single-phase current remains continuously
below the Single-Phase Current at Which Bank Switches Out setpoint for the
duration of the timer, the control switches the bank out.
Note: Voltage must remain in a range where switching the capacitor bank will not cause a
voltage-override condition.
Var Control Mode (IntelliCap with Var only)
When Automatic mode is enabled and the control is in Var mode, the control switches the
bank based on calculated 3-phase kvars (kilovoltamperes, reactive). The control uses the
following logic to determine when to switch the bank:
(a) The control monitors 3-phase kvar level.
(b) When the control senses the kvar level has passed the 3-Phase kvars at Which
Bank Switches In or 3-Phase kvars at Which Bank Switches Out setpoint, it
starts the Var Change Time Threshold timer.
(c) If the 3-phase kvar level remains continuously above the 3-Phase kvars at Which
Bank Switches In setpoint for the duration of the timer, the control switches the
bank in. If the single-phase kvar level remains continuously below the 3-Phase
kvars at Which Bank Switches Out setpoint for the duration of the timer, the
control switches the bank out.
Note: Voltage must remain in a range where switching the capacitor bank will not cause a
Voltage-Override condition.
Current Sensor Location and Reverse Current Flow
For the IntelliCap with Var control, the preferred location of the current sensor is on the
source side of the capacitor bank. The sensor can then measure the effect of the bank when
it is online. However, the control can still account for the effect of the bank when the sensor
is on the load side. This is particularly useful when abnormal circuit switching reverses the
direction of power ow, ipping the relative position of the sensor.
The control switches the bank based on the Adjusted 3-Phase kvars setpoint on the
Setup>Site-Related and Operation screens. See Instruction Sheet 1022-530, “IntelliCap®
Capacitor Control: Setup” for more information.
IntelliCap Control Operation
14 S&C Instruction Sheet 1022-540
IntelliCap Control Operation
Figure 5. Current sensor location and the direction of current flow combinations.
Figure 5 shows the four possible current-sensor locations and direction of current flow.
The operating conditions are described for current-flow direction:
A. Sensor on Normal Source Side with Normal Current Flow
The kvar level measured at the sensor location shows the effect of the bank. The Adjusted
3-Phase kvars setpoint equals the Measured 3-Phase kvars value.
B. Sensor on Normal Source Side with Reverse Current Flow
Abnormal circuit switching caused the current direction to reverse. The effect of the bank
is not shown in the measured kvars at the sensor location. The control calculates the
Adjusted 3-Phase kvars value by subtracting the 3-Phase Bank Size setpoint on the
Setup>Miscellaneous screen, from the Measured 3-Phase kvars value.
For example, an online 1200-kvar capacitor bank is set to switch out at -750 kvar. The
sensors are on the source side and current ow is reversed. When the load at the sensor
location is 450 kvar, the Adjusted 3-Phase kvars setpoint is 450 – 1200 = -750 kvar. The
bank then switches out.
C. Sensor on Load Side with Normal Current Flow
This occurs when the current sensor is on the load side of the bank or if permanent circuit
switching ips the sensor to the load side of the bank. See Description B “Sensor on Normal
Source Side with Reverse Current Flow” above.
D. Sensor on Load Side with Reverse Current Flow
See Description A “Sensor on Normal Source Side with Normal Current Flow” above.
Switching Trouble Conditions
Use the voltage and/or var values recorded before and after switching (on the Data
Logging>Voltage Levels During Switching and Data Logging>Var Levels During Switching
screens) to nd a possible bank-switch malfunction. A trouble condition exists if the change in
voltage (ΔV) is less than the Minimum Percentage of Average Delta Voltage setpoint over
the last four switching operations or if the change in vars (Δvar) is less than the Minimum
Percentage of Average Delta vars setpoint over the last four switching operations. The
percentage setpoints are congured on the Setup>Miscellaneous screen.
If the average ΔV is at least 0.80 V, the control can use ΔV to detect a trouble condition.
If the current sensor is on the source side of the bank, the control can use Δvar. When the
installation is favorable for both methods, the control uses ΔV and Δvar. It flags a trouble
condition only when they agree that a trouble condition has occurred. When the installation
is favorable for one method only, the control uses that method to flag a trouble condition.
Note: For trouble-condition detection analysis, the control does not use the ΔV from a
Forced Retry operation, which is an attempt to manually switch the bank into the state
already indicated.

S&C Instruction Sheet 1022-540 15
Viewing Data Logging
The Data Logging screens show high and low values and trend data for voltage amplitude,
temperature, and related parameters. When a customer complains of a service outage or low
voltage, the information on the Data Logging screens can help determine what happened
and why it happened. Data graphs can give an overview of trends before the data logs are
reviewed in detail.
Figure 6. The Data Logging Menu screen.
To display the Data Logging Menu screen, click on the Data Logging button. Screens that
show historical information for various time periods can be selected. See Figure 6.
To open the Data Logging: Daily Statistics for Last Month Menu screen, click on the Daily
High-Low button on the Data Logging Menu screen. See Figure 6. Screens can be selected
to show historical information for each day of the last month. Figure 7 shows the menu for
the IntelliCap with Var control. The menu for the standard IntelliCap control only contains
data for the options it supports.
Figure 7.The Data Logging: Daily Statistics for Last Month Menu screen.
Daily Statistics for the
Last Month

16 S&C Instruction Sheet 1022-540
Viewing Data Logging
Daily High and Low Data
The Daily High and Low screens show the highest and lowest values for voltage,
temperature, current, power factor, kvar, or kW for a 24-hour period (12 midnight to 12
midnight). The high/low data for today and for each of the preceding 31 days is available.
To display a Daily High and Low screen, click on the Data Logging button. Then click
on the Daily High-Low button. At the Data Logging: Daily Statistics for Last Month Menu
screen, click on the button for the type of data to view. If necessary, click on the PgUp and
PgDn buttons to move to the correct day. See Figure 8 on page 17. To return to the Data
Logging: Daily Statistics for Last Month Menu screen, click on the Daily High-Low button.
Each displayed value is the highest or lowest raw sample value for that parameter for the
specified day. The control takes a measurement every 0.2 seconds. The temperature sensor
located on the bottom of the enclosure measures the external temperature.
View the Daily Switching Cycles
The Data Logging: Daily Switching Cycles screen shows the number of bank switching
cycles for each day of the preceding 31 days during this calendar year and since installation.
Each cycle consists of a Close operation and an Open operation. The counters record both
automatic and manual switching operations.
To display the Data Logging: Daily Switching Cycles screen, click on the Data Logging
button, then click on the Daily High-Low button. At the Data Logging: Daily Statistics
for Last Month Menu screen, click on the Switching Cycles button. To return to the Data
Logging: Daily Statistics for Last Month Menu screen, click on the Daily High-Low but-
ton on the screen.
The screen includes the following fields:
Total This Year
This is the total number of switching cycles completed during this calendar year. The control
updates the counters when it switches the bank out.
Total Since Installation
This is the total number of switching cycles completed since installation of the control. The
control updates the counters when it switches the bank out. When the control software is
reloaded (not updated), this counter is reset to zero.
Reset All Cycle Counters
When this eld is set to the Enabled state, the control clears all bank switching cycle
counters. This is a momentary operation. When executed, the eld displays “Cleared” until
the rst switch-out event. The eld then displays “Disabled.”
View the Sensor Profile Screens
The Data Logging: Sensor Prole screens show prole data for voltage and temperature,
as well as current, power factor, kvars, and kW (if applicable). See Figure 8 on page 17 for
an example.
Follow these steps to display a Data Logging: Sensor Profile screen:
STEP 1. Click on the Data Logging button.
STEP 2. Click on the Sensor Proles button.
STEP 3. At the Data Logging: Sensor Prole Menu screen, click on the button for the type
of data to be viewed. If necessary, click on the PgUp or PgDn buttons to move to
the correct day.
STEP 4. To return to the Data Logging: Sensor Prole Menu screen, click on the Sensor
Prole button on the screen.
Sensor Profiles

S&C Instruction Sheet 1022-540 17
Figure 8. One of the Data Logging: Sensor Profile screens.
The Sensor Profile log includes data for 120 timestamped records. Each record contains 24
data samples. When the log is full, each new sample overwrites the oldest sample in the log.
The IntelliCap control uses the Extended Data Logging Interval setpoint on the
Setup>Miscellaneous screen for recording these numbers, which are interval-averaged
values. The control collects data at 0.2-second intervals. It averages eight samples to yield
the 1.6-second averaged value. It then adds together all the 1.6-second averaged values in
the interval (for example, 2:46 a.m. to 3:00 a.m. for a 15-minute data-logging interval) and
divides the total by the number of values.
The number of days logged depends on the configured interval. The control can log data
in 1-, 5-, 10-, 15-, 30-, or 60-minute intervals. Table 3 on page 18 shows how many days of
data are logged and how often the data are timestamped for each interval.
Note: If the data-logging interval is changed or when the control experiences a power
outage, up to two records (that is, 48 data samples) can be lost. Generate all necessary
reports before changing the data-logging interval.
When the data-logging interval is changed, the control starts at the first midnight in the
log and finds the record where the sample for the present time would appear if the new
interval had been used throughout. The control clears that entire record, timestamps it
appropriately, and logs the present sample in the correct location within the record. This
could cause gaps or repetitions in the timestamp sequence, depending on the change.
When the correct location for the present sample is after the end of the log, the control
clears the first record in the log and timestamps it with the date of the most recent midnight.
The control then calculates where the present sample should be (offset from this reset
midnight) and logs it. All other records are unaffected.
Similar logic applies to data logging after a power outage. When power is restored, the
control finds the correct location for the present sample. If the timestamp for the record
is incorrect, the control clears the entire record, timestamps it appropriately, and logs the
present sample. If the correct location for the present sample is after the end of the log, the
process is the same as for a new data logging interval.
When an IntelliCap control is returned from the field, generate all necessary reports as
soon as possible. This minimizes the amount of lost data.
Viewing Data Logging

18 S&C Instruction Sheet 1022-540
Viewing Data Logging
Table 3. Data Logging Intervals for Sensor Data Profiles
Data Logging Interval Days of Data Logged Record Timestamp Period
1 minute 2 days Once every 24 minutes
5 minutes 10 days Once every 2 hours
10 minutes 20 days Once every 4 hours
15 minutes 30 days Once every 6 hours
30 minutes 60 days Once every 12 hours
60 minutes 120 days Once every 24 hours
View the Voltage Levels During Switching
Every time the capacitor bank switches in or out (manually or automatically), the control
records the line voltage before and after switching. These values are shown on the Data
Logging: Voltage Levels During Switching screen.
Follow these steps to display the Data Logging: Voltage Levels During Switching screen:
STEP 1. Click on the Data Logging button.
STEP 2. Click on the Switching Data button.
STEP 3. At the Data Logging: Switching Data Menu screen, click on the Voltage Levels
button.
STEP 4. To return to the Data Logging: Switching Data Menu screen, click on the
Switching Data button.
This log includes data for 14 complete switching cycles. When the log is full each new
event overwrites the oldest event in the log. To find the most recent event, look for the
message with a timestamp that is older than the time for the message above it.
For both voltage measurements, before and after switching, the control takes a measure-
ment every 0.2 seconds. It sums eight consecutive samples and divides the total by eight to
yield a 1.6-second averaged value. The before-switching measurement is taken just before
the bank switches are operated. The after-switching measurement is taken approximately
3.5 seconds after the switches are operated.
Use the information on this screen to look for possible equipment malfunction during
switching (see the “Switching Trouble Conditions” section on page 14) and to check the
switching times. It is also useful for determining the Bank Voltage Change + Margin:
Estimated Value setpoint on the Setup>General screen. When the Bank Voltage Change
+ Margin: Automatic Calculation mode is enabled, the control uses the delta values
shown on this screen in the calculation. See Setup Instructions 1022-530, “S&C IntelliCap®
Automatic Capacitor Control: Setup” for more details.
This screen includes the following fields:
Date and Time
This is the date and time the switching operation occurred.
Voltage Before
This is the line voltage before the control switched the bank.
Voltage After
This is the line voltage after the control switched the bank, measured approximately
3.5 seconds after the end of a pulse.
Delta
This is the change in voltage because the bank switched.
Note: Because of the way the control rounds and stores voltage values, the delta value
displayed may be slightly different from the Voltage Before value minus the Voltage
After value.
Switching Level Data

S&C Instruction Sheet 1022-540 19
Viewing Data Logging
View the kvar Levels During Switching
For the IntelliCap with Var control, every time the bank switches in or out (manually or
automatically), the control records the kvar levels before and after switching. These values
are shown on the Data Logging: kvar Levels During Switching screen.
Follow these steps to display the Data Logging: kvar Levels During Switching screen:
STEP 1. Click on the Data Logging button.
STEP 2. Click on the Switching Data button.
STEP 3. At the Data Logging: Switching Data Menu screen, click on the kvar Levels
button.
STEP 4. To return to the Data Logging: Switching Data Menu screen, click on the
Switching Data button on the screen.
This log includes data for 14 complete switching cycles. When the log is full, each new
event over-writes the oldest event in the log. To find the most recent event, look for the
message with a time stamp older than the time for the message above it.
For both kvar measurements, before and after switching, the control takes a measure-
ment every 0.2 seconds. It sums eight consecutive samples and divides the total by eight to
yield a 1.6-second averaged value. The before-switching measurement is taken just before
the bank switches are operated. The after-switching measurement is taken approximately
3.5 seconds after the bank switches are operated.
Use the information on this screen to look for possible error conditions during switch-
ing to check the switching times and to monitor the health of the capacitor bank. See the
“Switching Trouble Conditions” section on page 14.
This screen includes the following fields:
Date and Time
This is the date and time the switching operation occurred.
kvars Before
This is the kvar value before the control switched the bank.
kvars After
This is the kvar value after the control switched the bank.
Delta
This is the change in kvars because of the bank switching. If the bank is operating normally,
this is a negative number when the bank is switched in and a positive number when the
bank is switched out.
View the Switching Events Log
Whenever the bank switches in or out (manually or automatically), the control records
the time, date, and request type. These values are shown on the Data Logging: Switching
Events screen.
Follow these steps to display the Data Logging: Switching Events screen:
STEP 1. Click on the Data Logging button.
STEP 2. Click on the Switching Data button.
STEP 3. At the Data Loggging: Switching Data Menu screen, click on the Switching
Events button.
STEP 4. To return to the Data Logging: Switching Data Menu screen, click on the
Switching Data button on the screen.
This log includes data for 14 complete switching cycles. When the log is full, each new
event over writes the oldest event in the log. To find the most recent event, look for the mes-
sage with a timestamp older than the time for the message above it. This screen includes
the following fields:
Event Logs

20 S&C Instruction Sheet 1022-540
Viewing Data Logging
Date and Time
This is the date and time when the switching operation occurred.
Request Type
This is the type of request (manual, voltage override, etc.) that caused the bank to switch.
View the Power Outages Log
The Data Logging: Power Outages screen shows the date and time of the last 15 power cycles.
To display the Data Logging: Power Outages screen, click on the Data Logging button.
Then, click on the Power Outages button.
This log can hold information for 15 power failures and 15 power restorations. When the
log is full, each new event over-writes the oldest event in the log. To find the most recent
event, look for the message with a timestamp older than the time for the message above it.
View the Data Graphing Screens
The Data Graphing screens provide quick access to historical data displayed as graphs.
The control automatically scales each graph to show as much detail as possible. Graphs are
available for daily highs and lows for the last month and for sensor proles.
Follow these steps to display daily highs and lows:
STEP 1. Click on the Data Graphing button.
STEP 2. Click on the Daily High-Low button.
STEP 3. At the Data Graphing: Daily Statistics for Last Month Menu screen, click on the
button for the type of data to be viewed. The IntelliLink software reads the
appropriate data from the control and displays a graph as a separate screen. See
Figure 9.
Figure 9. One of the Data Graphing: Daily Statistic screens.
Data Graphing
Other manuals for IntelliCap
1
Table of contents
Other S&C Controllers manuals

S&C
S&C Micro-AT User manual

S&C
S&C IntelliCap Plus Operating instructions

S&C
S&C Vista Owner's manual

S&C
S&C Micro-AT Instruction Manual

S&C
S&C Micro-AT User manual

S&C
S&C PMH Operation and maintenance manual
S&C
S&C BankGuard PLUS Guide

S&C
S&C 6802 User guide

S&C
S&C IntelliCap User manual

S&C
S&C 6800 Series User manual

S&C
S&C TripSaver II User manual

S&C
S&C GridMaster User manual

S&C
S&C 5800 Series User manual

S&C
S&C Micro-AT User manual

S&C
S&C BankGuard PLUS User manual

S&C
S&C 6800 Series User manual

S&C
S&C Vista SD Owner's manual

S&C
S&C IntelliCap 2000 User manual

S&C
S&C BankGuard PLUS Instruction Manual
S&C
S&C BankGuard PLUS Manual