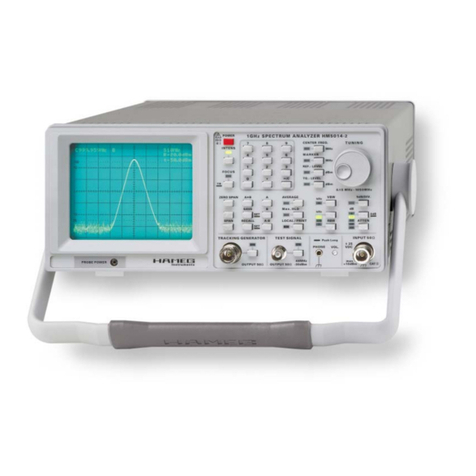
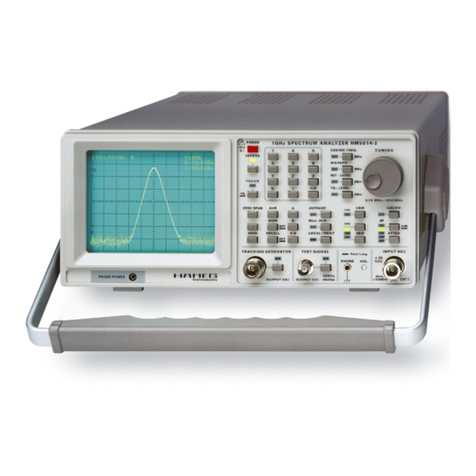
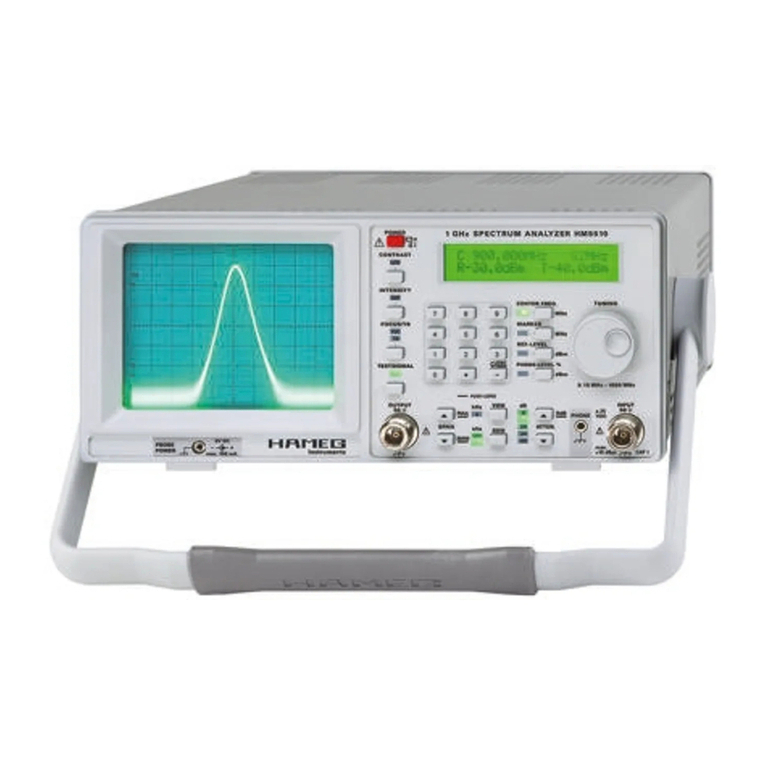
Hameg HM5014-2 User manual

Spectrum Analyzer
HM5014-2
Service Manual
Release: April, 2008

2Subject to change without notice
Die HAMEG GmbH bescheinigt die Konformität für das Produkt
The HAMEG GmbH herewith declares conformity of the product
HAMEG GmbH déclare la conformité du produit
Bezeichnung / Product name / Désignation:
Spektrumanalysator
Spectrum Analyzer
Analyseur de spectre
Typ / Type / Type: HM5014-2
mit / with / avec: –
Optionen / Options / Options: –
mit den folgenden Bestimmungen / with applicable regulations /
avec les directives suivantes
EMV Richtlinie 89/336/EWG ergänzt durch 91/263/EWG, 92/31/EWG
EMC Directive 89/336/EEC amended by 91/263/EWG, 92/31/EEC
Directive EMC 89/336/CEE amendée par 91/263/EWG, 92/31/CEE
Niederspannungsrichtlinie 73/23/EWG ergänzt durch 93/68/EWG
Low-Voltage Equipment Directive 73/23/EEC amended by 93/68/EEC
Directive des équipements basse tension 73/23/CEE amendée par 93/68/CEE
Angewendete harmonisierte Normen / Harmonized standards applied / Normes
harmonisées utilisées
Sicherheit / Safety / Sécurité
EN 61010-1:2001 (IEC 61010-1:2001)
Hersteller HAMEG Instruments GmbH KONFORMITÄTSERKLÄRUNG
Manufacturer Industriestraße 6 DECLARATION OF CONFORMITY
Fabricant D-63533 Mainhausen DECLARATION DE CONFORMITE
Messkategorie / Measuring category / Catégorie de mesure: I
Verschmutzungsgrad / Degree of pollution / Degré de pollution: 2
Elektromagnetische Verträglichkeit / Electromagnetic compatibility /
Compatibilité électromagnétique
EN 61326-1/A1 Störaussendung / Radiation / Emission:
Tabelle / table / tableau 4; Klasse / Class / Classe B.
Störfestigkeit / Immunity / Imunitée:Tabelle / table / tableau A1.
EN 61000-3-2/A14 Oberschwingungsströme / Harmonic current emissions /
Émissions de courant harmonique:
Klasse / Class / Classe D.
EN 61000-3-3 Spannungsschwankungen u. Flicker / Voltage fluctuations and flicker /
Fluctuations de tension et du flicker.
Datum /Date /Date
15. 07. 2004
Unterschrift / Signature /Signature
Manuel Roth
Manager
General information concerning the CE marking
HAMEG instruments fulfill the regulations of the EMC directive. The
conformity test made by HAMEG is based on the actual generic- and
product standards. In cases where different limit values are applicable,
HAMEG applies the severer standard. For emission the limits for
residential, commercial and light industry are applied. Regarding the
immunity (susceptibility) the limits for industrial environment have
been used.
The measuring- and data lines of the instrument have much influence
on emission and immunity and therefore on meeting the acceptance
limits. For different applications the lines and/or cables used may
be different. For measurement operation the following hints and
conditions regarding emission and immunity should be observed:
1. Data cables
For the connection between instruments resp. their interfaces and
external devices, (computer, printer etc.) sufficiently screened cables
must be used. Without a special instruction in the manual for a reduced
cable length, the maximum cable length of a dataline must be less than
3 meters and not be used outside buildings. If an interface has several
connectors only one connector must have a connection to a cable.
Basically interconnections must have a double screening. For IEEE-bus
purposes the double screened cable HZ72 from HAMEG is suitable.
2. Signal cables
Basically test leads for signal interconnection between test point and
instrument should be as short as possible. Without instruction in the
manual for a shorter length, signal lines must be less than 3 meters
and not be used outside buildings.
Signal lines must screened (coaxial cable - RG58/U). A proper ground
connection is required. In combination with signal generators double
screened cables (RG223/U, RG214/U) must be used.
3. Influence on measuring instruments
Under the presence of strong high frequency electric or magnetic fields,
even with careful setup of the measuring equipment an influence of
such signals is unavoidable.
This will not cause damage or put the instrument out of operation. Small
deviations of the measuring value (reading) exceeding the instruments
specifications may result from such conditions in individual cases.
4. Noise immunity of spectrum analyzers
In the presence of strong electric or magnetic fields it is possible that
they may become visible together with the signal to be measured. The
methods of intrusion are many: via the mains, via the signal leads, via
control or interface leads or by direct radiation. Although the spectrum
analyzer has a metal housing there is the large CRT opening in the
front panel where it is vulnerable. Parasitic signals may, however, also
intrude into the measuring object itself and from there propagate into
the spectrum analyzer.
HAMEG Instruments GmbH

3
Subject to change without notice
Contents
Spectrum Analyzer HM5014-2 4
Specifications 5
1. Basics 6
1.1 Block Diagram and Functional Description 6
1.2 Modules and Interconnections 9
1.3 Measurement Equipment and Accessories 10
2.Performance and Functional Tests 12
2.1 Test Instructions 12
2.2 Basic Performance Tests 12
3. Adjustment 16
3.1 Preliminary Instructions 16
3.2 Adjustments 16
4. Troubleshooting of the HM5014-2 20
5. Module Replacement 21
5.1 Opening the instrument 21
5.2 Replacement of XYZ-Board 21
5.3 Replacement of interface module 22
5.4 Replacement of IF-Unit 22
5.5 Replacement of CPU-Board 22
5.6 Replacement of PS-Board 22
5.7 Replacement of Tracking generator 23
5.8 Replacement of ATT module (TG path) 23
5.9 Replacement of RF-Box 23
5.10 Replacement of RF ATT module 24
5.11 Replacement of KEY board 24
5.12 Replacing the front cover 24
5.13 Replacement of the Rear Cover 24
5.14 Replacement of CRT module 24
5.15 Replacement of the RF Input Connector /
TG connector 25
5.16 Replacement of the Test Signal Connector 25
5.17 Replacement of the Power Probe Plug 25
5.18 Putting the Instrument into Operation 25
5.19 Completing the Instrument 25
5.20 Final Performance Test 25
6. Spare Parts Handling 26
6.1Shipping of Instrument or Modules 26
6.2Ordering Spare Parts 26
6.3Spare Parts List 26
6.4Hameg Tool Kit HM5014-2 26

4Subject to change without notice
HM5530
Frequency range from 150 kHz to 1 GHz
Amplitude measurement range from -100 dBm to +10 dBm
Phase Synchronous, Direct Digital frequency Synthesis (DDS)
Resolution bandwidths (RBW): 9 kHz, 120 kHz and 1 MHz
Pre-compliance EMI measurements
Software for documentation included
Software for extended measurement functions for
EMI measurements included
Tracking Generator with output amplitude from -50 dBm to +1 dBm
Serial interface for documentation and control
1 GHz Spectrum Analyzer
HM5014-2
HM5014 2
Measurement of
line-conducted interference
Amplifier frequency
response measured using a
tracking generator
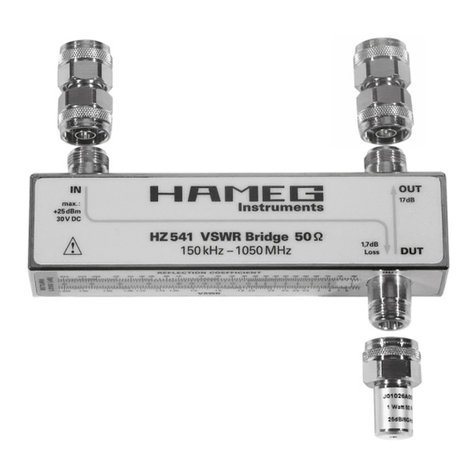
VSWR Test Unit HZ541
included

5
Subject to change without notice
Specifications
1 GHz Spectrum Analyzer HM5014-2
Valid at 23 °C after a 30 minute warm-up period
Frequency Characteristics
Frequency Range : 0.15 MHz to 1.050 GHz
Stability: ± 5 ppm
Ageing: ±1ppm/year
Frequency Resolution: 1kHz(61⁄2digit in readout)
Center Frequency Range: 0 to 1.050 GHz
LO Frequency Generation: TCXO with DDS (Digital Frequency Synthesis)
Span Setting Range: Zero Span and 1 MHz –1000 MHz
(1-2-5 Sequence)
Marker:
Frequency Resolution: 1 kHz, 6 1⁄2digit,
Amplitude Resolution: 0.4 dB, 3 1⁄2digit
Resolution Bandwidths
(RBW) @6dB: 1 MHz, 120 kHz and 9 kHz
Video Bandwidth (VBW): 4kHz
Sweep Time
(automatic selection): 40 ms, 320 ms,1 s*)
Amplitude Characteristics (Marker Related) 150 kHz – 1 GHz
Measurement Range: -100 dBm to +10 dBm
Scaling: 10 dB/div., 5 dB/div.
Display Range: 80 dB (10 dB/div.),
40 dB (5 dB/div.)
Amplitude Frequency Response (at 10 dB Attn., Zero Span and RBW 1 MHz,
Signal – 20 dBm): ±3dB
Display (CRT): 8 x10 division
Amplitude Scale: logarithmic
Display units: dBm
Input Attenuator Range: 0 – 40 dB (10 dB-increments)
Tolerance of input attenuator: ± 2 dB relative to 10 dB position
Max. Input Level (continuous)
40 dB attenuation: +20 dBm (0,1 W)
0 dB attenuation: +10 dBm
Max. DC Voltage: ±25V
Max. Reference Level: +10 dBm
Reference Level Accuracy rel. to 500 MHz, 10 dB Attn., Zero Span and
RBW 1 MHz: ±1dB
Min. Average Noise Level: ca. -100 dBm (RBW 9 kHz)
Intermodulation Ratio
(3rd Order): typical ›75 dBc (2 Signals: 200 MHz,
203 MHz, -3 dB below Reference Level)
Harmonic Distortion Ratio
(2nd harm.): typical › 75dBc (200MHz, Reference Level)
Bandwidth Dependent Amplitude Error rel. to RBW
1 MHz and Zero Span: ±1dB
Digitization Error: ±1 digit (0.4 dB) at 10 dB/div. scaling
(Average, Zero Span)
Inputs/Outputs
Measuring Input: N socket
Input Impedance: 50 Ω
VSWR: (Attn. ≥10 dB) typ. 1.5:1
Tracking Generator Output: N-socket
Output Impedance: 50 Ω
Test Signal Output: BNC-Buchse
Frequency, Level: 48 MHz, -30 dBm (± 2 dB)
Supply Voltage for Probes (HZ 530): 6VDC
Audio Output (phone): 3.5mm Ø jack
RS-232 Interface: 9pol./Sub-D
Functions
Keyboard Input: Center Frequency, Reference Level,
Tracking Generator Level
Rotary Encoder Input: Center Frequency, Reference Level, Marker,
Tracking Generator Level
Max. Hold Detection: Peak Value Acquisition
Quasi-Peak Detection:* Quasi-Peak Valuation
Average: Mean Value Acquisition
Ref. Spectrum Memory: 2kx 8bit
SAVE / RECALL: Save and Recall of 10 Instrument Settings
AM demodulation: for audio
LOCAL: RS-232 Remote Control OFF
Readout:
Display of various Measurement Parame
ters
Tracking Generator
Frequency Range: 0.15 MHz to 1.050 GHz
Output Level: -50 dBm to +1 dBm
Frequency Response (0.15 MHz – 1 GHz)
+1 dBm to -10 dBm: ± 3 dB
-10,2 dBm to -50 dBm: ± 4 dB
Digitization Error: ±1 digit (0.4 dB)
Spurious Outputs better than 20 dBc
General information
CRT: D14-363GY, 8 x 10 cm with internal graticule
Acceleration Voltage: approx. 2 kV
Trace Rotation: adjustable on front panel
Ambient Temperature: 10°Cto 40°C
Power Supply: 105-253 V, 50 /60 Hz ± 10 %, CAT II
Power Consumption: approx. 35 W at 230V/50 Hz
Safety Class Safety Class I (EN61010-1)
Dimensions (W x H x D): 285 x 125 x 380 mm
Weight: approx. 6.5 kg
*) in combination with software AS100E only
Accessories supplied: Line Cord, Operators Manual, HZ21 Adapter Plug
(N-plug with BNC socket) and Software for Windows on CD-ROM
Optional accessories:
HZ70 Opto-Interface (with optical fiber cable)
HZ520 Antenna
HZ530 Near Field Probe Set for EMI Diagnosis

6Subject to change without notice
1. Basics
1. Basics
1.1 Block Diagram and Functional Description
10 wire
ribbon
cable
RiC11
fi x e d
SMB
fi x e d
SMB
fi x e d fi x e d
CiC1 CiC2
WiC6
WiC8
WiC5
Probe
Power 6 wire
ribbon
cable
RiC7
10 wire Ribbon Cable
SMB
4
wire
Part of RiC9
RiC13
direct
AC
Socket
RiC9
16 wire Ribbon Cable RiC6
Part of RiC5/RiC6
10 wire Ribbon Cable RiC4
CiC8
6
wire
RiC10
4 WiC2
6 wire
ribbon
cable
RiC2
WiC4
6
wire
RiC12
10 wire
ribbon
cable
RiC5
CiC3
SMB
CiC4
direct
SMB
SMB
CiC5
CiC7
WiC3
SMB fi x e d
SMB
SiC2
HM5014-2 - 1 GHz Spectrum Analyzer
Block diagram
SMB
RF Attenuator
10 / 20 / 10 dB
Low Pass
SMA
1st Mixer
1369,3 MHz
6
2nd
Mixer
3rd
Mixer 1 MHz
1st LO
2nd
LO 3rd LO
DC
Offset
Control Logic
Keyboard
Controller
Audio-Ampl.
Probe Power
Supply
Switchmode
Power Supply
–12 V +5 V +32 V
–2000 V +12 V +141 V
TG-LO
1369.3 MHz
Gain
Control
PLL
TG-LO
Ampl.
REF.
PLL
1st LO PLL
2nd LO
TG-Mixer
CRT
RAT-
Board
SiC1
CAVITY-
Filter
IF Amp.
Oscillator
1369,3 - 2419,3 MHz
1
ATD -
Board
Attenuator
Driver
KEY-
Board
ATD -
Board
Attenuator
Driver
RAT-
Board
TG Attenuator
10 / 20 / 10 dB
Ampl.
LP
TG-
Board 4
RFA-
Board
RFB-
Board
Low Pass
Oscil-
lator
2nd IF
Ampl.
RFC-
Board
LP
30 MHz
LP
10,7 MHz
IFA-
Board
23
LIN
LOG
Video Filter
120
kHz
9
kHz
CPU-
Board
D
A
D
A
A
D
TCXO
Reference
96 MHz
2
2
48 MHz
DDS
16 – 28
MHz
Digital
Sweep
Generator
Main
CPU
RAM EProm
Digital
Control
CRT/
Video
Control
Trace
Rotation
Signal
RAM
24 MHz TG Lev.
HOR
VERT
UNBLANK
FOCUS
RS-232
Interface
PS-
Board YXZ-
Board
HOR FIN
AMP
UNBLANK
AMP
VERT FIN
AMP
FOCUS CONTROL
SUB-D
Connection
RF INPUT
Test
Signal
Audio
(located on
keyboard)
TG
Output
RF BOX IF UNIT
fi x e d
SMB
SMB SMB
SMA
1340 MHz 40 MHz
1
23
4 5
7
9
10 11
8
12
13
14
15
16
17
18
19 20 21
22
26
24
23
25
30
31
33
34
32
35
42 36
38
39
37
40
41
49
53
52
51
50
67
64
65
63
66
62
61
60

7
Subject to change without notice
1. Basics
The HM5014-2 spectrum analyzer consists of the following ba-
sic modules. The main RF process circuits are concentrated
in the following units:
– RF Box
– IF Unit
– RAT / ATD attenuator assembly (2 per unit)
– TG Unit
The control modules are:
– CPU Board
– XYZ Board
– KEY Board
The auxiliary modules are:
– PS Board
– CRT module
– Interface module
The functional description will make frequent references to
the block diagram. The encircled numbers in the text and the
corresponding numbers in the block diagram assist orienta-
tion in the circuit.
RF Box
The RF Box is the main part of the receiver circuit of the spec-
trum analyzer. Three blocks together form one RF Box: the RFA
and RFB PCBs and the cavity filter
6
. Both PCBs are fixed to
the cavity filter. Due to both PCBs and the cavity filter forming
a very complex unit it is not possible to change one part of the
RF Box individually, the adjustment required would exceed the
scope of this manual considerably.
The input signal exiting the attenuator via 2 directly connected
SMB connectors is routed to the 1st mixer via a low pass filter
1
thus avoiding ambiguities due to subharmonic mixing. The 1st
mixer
2
has been carefully adjusted for best LO suppression
and bandwidth. It is fed by the 1st local oscillator (LO)
4
. The
1st LO is a wideband voltage controlled oscillator (VCO) that pro-
vides a mixing signal from 1369,3 to 2419,3 MHz, depending on the
reference signal “DDSFRQ” input via CIC8 from the CPU Board.
The frequency range of the “DDSFRQ” signal is from 16 to 28
MHz The RFA PLL
5
multiplies the “DDSFRQ” signal with a
fixed factor to produce the desired 1st LO frequency. The si-
gnal of the 1st LO is also fed into CIC3 as tuning signal for the
tracking generator (TG Unit).
Behind the mixer the 1st low noise IF amplifier
3
is located,
then the 1st IF signal leaves the RFA PCB as it enters the cavity
filter
6
, which is preadjusted to a passband center frequency
of 1369,3 MHz. After passing the cavity filter, the 1st IF signal
enters the RFB PCB to be conducted via a low pass filter
7
to
the 2nd mixer
8
, converting the signal to 29,3 MHz. The 2nd
local oscillator (LO)
11
is a 1340 MHz VCO based on a ceramic
resonator controlled by a PLL
10
referenced to the “REFSIG”
signal from CPU Board via CiC4. The frequency of this refe-
rence signal is 24 MHz.
The 2nd IF signal from the 2nd mixer is amplified in the 2nd IF
amplifier and is fed to CIC 1, leading to the IF unit.
The ribbon cable to the RF Box reaches the box via CRA board
fixed to the underside of the RFA casing, from CRA board RiC 13
connects the necessary supply voltages to CRB board, fixed to
the underside of the RFB casing. These 2 PCBs are not accces-
sible when the RF box is mounted in the chassis, only the con-
nector for RiC 4. They are not shown in the block diagram.
IF Unit
The IF Unit consists of the RFC board, the IFA board and the two
mounting aluminium sheets, as well as the interconnections
between the PCBs. The boards can only be changed as a unit,
because they have been specially matched in the factory.
The IF signal enters the RFC board via CIC 1, after passing a
low pass filter
12
and a band pass filter it reaches the 3rd mi-
xer
13
, where the signal is converted to the 3rd IF of 10,7 MHz,
where again a low pass
14
filter is located.
The 3rd local oscillator (LO) signal is generated with a crystal
oscillator
15
tuned to 40 MHz.
CIC 2 connects the 3rd IF output of the RFC board to the input
of the IF board, which contains the resolution bandwidth (RBW)
filters
16
-
18
, the logarithmic detector
19
and amplifier and
the video filter
20
as well as levelling circuitry for matching the
3 filter output amplitudes
21
.
The signal passes the 1000 kHz RBW filter
16
and the control
logic inserts either the 120 kHz filter
17
into the signal path or
also the 9 kHz filter
18
, depending on the control signals
22
.
The logarithmic amplifier
19
demodulates the 10,7 MHz 3rd IF
signal and gives a very precise logarithmic representation of the
amplitude value as an output voltage. This voltage then passes
the video filter
20
with either 50 kHz or 4 kHz video bandwidth
(VBW). Finally the output level for the 3 filters is matched in the
output amplifier
21
of the IF board. The video signal is routed
via RiC 5 to the CPU board.
The ribbon cable Ric5 serves both the RFC Board and the IFA
Board, using an extra connector crimped onto the cable.
RAT /ATD attenuator assembly
The 2 attenuators are located between the input / output con-
nectors of the HM5014-2 and the RF Box and the TG Board. Both
assemblies are identical, as well as the identical attenuator
driver PCB, called ATD Board. These attenuators comprise
circuitry to set attenuation in 10 dB steps from 0 dB to 40 dB.
This is accomplished via relays and divider networks. The at-
tenuator is controlled by logical signals and a demultiplexer to
deliver the signals driving the relays.
TG Unit
The TG Unit is a generator for producing the exact signal the
spectrum analyzer is receiving at this special moment of a
sweep, thus providing easy twoport measurements. It consists
of a PLL
66
using the 24 MHz reference signal from the TCXO
30
located on the CPU Board to provide a stable fixed local oscil-
lator (LO)
67
signal of 1369.3 MHz. This signal is mixed with the
signal momentarily produced by the 1st LO of the RFA Board
(e. g. the receiver) to give the exact reproduction of the recei-
ving frequency for each possible 1st LO frequency. The signal
then is fed to a gain controlled amplifier
61
via a low pass filter
64
. Between output and the gain controlled amplifier the level
detector
60
is located to obtain the gain control voltage from
the output signal in combination with the level control voltage
8Subject to change without notice
1. Basics
from the CPU Board. The output signal is then fed directly via
2 SMB connectors to the TG attenuator.
CPU Board
The CPU Board contains most of the digital control circuitry,
the TCXO reference
30
, the complete digital signal processing
circuits, the digital sweep generator
34
and the DDS refe-
rence generator for the 1st LO
33
as well as control circuitry
for analog control signals to TG Board
42
, XYZ Board
36
+
37
and the CRT
41
. The CPU Board also communicates with the
KEY Board to obtain input from the user. In addition, the serial
communication for the RS-232 interface is provided for flexible
data transfer from and control of the HM5014-2. Also located
on the CPU Board is the ASIC for the readout of the spectrum
analyzer, also providing the display data given to the D/A con-
verters
37
for X and Y signals to CRT.
The video signal from the IF Unit enters the CPU Board where
ist is digitized and stored in the signal RAM
39
. Now the raw
data is shifted to the correct position of the reference level
setting and also the B-A representation is calculated using
the data stored in the signal RAM. The main CPU
35
then pro-
cesses the data, and provides it to the readout ASIC so it can
be displayed on the CRT after D/A conversion
37
and the dot
join circuit – an integrator for best interpolation of adjacent
sample representations.
The CPU Board also contains the highly stable reference oscil-
lator for the entire unit, a 96 MHz TCXO
30
used for several pur-
poses throughout the unit. Its main use is the clocking of the
DDS generator
33
on the CPU Board, which is the reference
for the 1st LO
4
on RFA Board. Derived from these 96 MHz are
also the 2 reference signals for the RFB and TG Boards as well
as the 48 MHz test signal provided on the front panel (after a
levelling stage)
31
+
32
.
The digital sweep generator controls the sweep time accor-
ding to the setting by the user for maintaining best signal and
amplitude representation.
The main CPU
35
on the CPU Board is quite straightforward,
using an EPROM for storing the firmware and a RAM for storing
the necessary data, as well as providing control and commu-
nication for the entire spectrum analyzer and external devices
via serial interface.
XYZ Board
The XYZ Board is fixed to the back end of the CRT via the CRT
socket. It contains circuits for the X
50
and Y
52
signal deflection
amplifiers. Also present is the unblanking circuit
51
controlling
the intensity of the CRT and its focus
53
.
STOP
CAUTION:
A part of the XYZ Board is operated at a voltage of
2000 Volts.
KEY Board
The KEY Board consists of a microcontroller (keyboard con-
troller
23
) to control the reading of keys
24
and illumination of
the LEDs on the KEY Board. Also present are the audio signal
amplifier
25
which converts the video signal to an audio signal
of the desired amplitude, and the probe power supply
26
for
externally connected probes. The control outputs to both atte-
nuators are also generated by the keyboard controller
23
. The
input from the rotary encoder is processed by the keyboard
controller.
The microcontroller is in constant communication with the
main CPU
35
of the CPU Board.
PS Board
The PS Board comprises a switchmode power supply capable
of accepting input voltages from 105 to 253 Volts AC providing
all the voltages needed inside the instrument, some with a
highly stable linear regulating circuit.
CRT Module
The CRT Module consists of the CRT enveloped in mu-metal
for immunity to external magnetic fields. The mu-metal loses
its capabilities when bent after treatment and should not be
removed from the CRT.
STOP
CAUTION:
The CRT contains a high vacuum inside and may
implode if handled or treated improperly.
Interface module
The interface module is a RS-232 converter module between
the internal logic level and the logic levels demanded by the
RS-232 standard. It is located on the upper rear side of the
instrument.

9
Subject to change without notice
REAR VIEW
Fuse F1
PS Module
IF Module
XYZ Module
TOP VIEW
CPU board
KEY
Module
IF unit
– IF filter
– RFC board
Interface
CRT Module
PS Module
(with cover)
BOTTOM VIEW
KEY Module
XYZ Module
PS Module
(with cover)
RF Box
CRT Module
SIDE VIEW
IF unit CPU Board
KEY Module PS Module
1. Basics
1.2 Modules and Interconnections
TG Module
RAT
Module

10 Subject to change without notice
Measurement setup 2
This setup is used whenever a frequency source inside the
HM5014-2 is to measured to determine the exact frequency.
The frequency counter [M4] has to be connected to an external
reference with a minimum accuracy of 1E-9, if not otherwise
specified.
1. Basics
1.3 Measurement Equipment and Accessories
Item Type of Equipment Equipment minimum
requirements
Recommended Equipment Purpose
M1 RF Signal Generator HM8134-3 with inter-
face
HM8135 with interface Used as signal source in multiple
procedures
M2 Power Meter Rohde&Schwarz
NRVS
Rohde&Schwarz NRVS Tracking Generator adjustment,
Test Signal adjustment
M3 Insertion Unit (for M2) 100 kHz to 1.05 GHz Rohde&Schwarz NRV-Z5 or
Rohde&Schwarz NRV-Z4
Tracking Generator adjustment,
Test Signal adjustment
M4 Frequency Counter Frequency Measure-
ment Accuracy: 0.001
ppm, External Refer-
ence
HAMEG HM8123 HM5014-2 TCXO and XO adjustment
M5 N Coaxial cable 50 Ohm, DC-8 GHz,
N connectors (male/
male) Length 1 – 1.5 m
Huber&Suhner No.
23023806
Signal interconnection
M6 SMB /BNC Coaxial Adap-
tor
50 Ohm, SMB male,
BNC female
Schuricht 33-SMB-
BNC-50-2 (Huber+Suhner)
Signal interconnection
M7 RS-232 cable Connector 9-pin Sub-D
(male/female), length
1-2.5 m
HAMEG HZ14 Interface connection, PC to
HM5014-2
M8 Coaxial Cable BNC-BNC BNC male Connec-
tor both ends, length
1-1.5 m
HAMEG HZ34 Signal interconnection
M9 Coaxial Cable
N to SMA
50 Ohm, DC … 6 GHz,
N-connector (male),
SMA connector (male),
length 1 – 1.5 m
Huber&Suhner No.
23005050
Connection of TG output to frequen-
cy counter
M10 Digital Multimeter 3 1/2 digit resolution HM8012 Measurement of probe voltage
M11 Adaptor N-BNC 50 Ohm N male, BNC
female
HZ21 Signal interconnection
Table 1-1
Measurement setup 1
This setup is used whenever a signal has to be provided for
the HM5014-2. It is used in multiple steps during checking
and adjustment. The synthesizer [M1] has to be connected to
an external reference with a minimum accuracy of 1E-9, if not
otherwise specified.
RF OUTPUT
RF INPUT
N cable
(M5)
HM8134-3
(M1)
HM5014-2
Figure 1.3.1: Measurement SETUP 1
Input A
BNC cable
(M8)
Adapter
(M7)
HM5014-2
HM8123
(M4)
Figure 1.3.2: Measurement SETUP 2
Input C
A
B C

11
Subject to change without notice
1. Basics
TG OUTPUT
Insertion unit
(M3) HM5014-2
NRVS
M2
Figure 1.3.3: Measurement SETUP 3
Item Type of Accessories, Requirements Purpose
A1 “Screwdriver” with ceramic blade for adjustment (older
version), Murata No. KMTZ16F
Adjustment of TCXO (older version)
A2 “Screwdriver” with ceramic blade for adjustment (newer
version), Murata No. KMTZ11V
Adjustment of TCXO (newer version)
A3 Jaw wrench with wrench size 8 mm (max 3 mm thick) Removing / mounting SMA nuts, semi-rigid cables
A4 Screwdriver for crosshead screw Removing / mounting screws
A5 Screwdriver for adjustment purposes Adjustment of various potentiometers
A6 Pair of long-nosed pliers Removing or mounting connectors
A7 Serial Interface IF unit is equipped with interface other than serial
A8 Probe power test cable Measuring probe supply
A9 Jaw wrench with wrench size 5.5 mm Removing / Mounting hex nuts
Measurement setup 3
This measurement setup is used to determine the power of
signals over the entire frequency range of the HM5014-2. The
NRVS [M2] is always used with the insertion unit [M3].
Table 1-2

12 Subject to change without notice
2.1 Test Instructions
STOP
Warning:
Do not perform internal service or adjustment
of this product unless another person capable of
rendering first aid and resuscitation is present.
“Do not service alone”
STOP
Warning:
Dangerous voltages exist at several points in this
product. To avoid personal injury, do not touch ex-
posed connections and components while power is
on. “Use care when servicing with power on”
Disconnect power before removing protective panels, soldering
or replacing components.
The following procedures assume that the HM5014-2 is con-
nected to mains/line via a safety class II transformer. Only
qualified personnel who are aware of the danger of electricity
should execute the following procedures. If cables or connec-
tors have to be disconnected, the instrument must be switched
off before the removal.
It is further assumed that the personnel executing the fol-
lowing procedures are acquainted with the operation of the
instruments used and their use. The operation of the HM5014-
2 is described in detail in the user manual downloadable at
the HAMEG website, so it is not repeated here. Only special
commands not included in the user manual are described
as needed.
Note: The instrument must have a 30-minute warmup period
before making any checks or adjustments. Per forming the ad-
justment or the checking procedure while the temperature is
drifting may cause erroneous adjustment setting and check re-
sults. During warm-up, the instrument is to be operated inside
the casing. The ambient temperature must be 23°C ±2°.
To ensure proper conditions for the performance check and
prevent settings errors, the instrument must be prepared as
follows:
– Allow a minimum warm-up time of 30 minutes at ambient
temperature (unit must be inside casing)
– Switch off the HM5014-2 and then switch it on again
– Set the HM5014-2 to the following:
– Center frequency 500 MHz
– Span 1000 MHz
– ATT 10 dB
– TG off
– RBW 1000 kHz
– VBW not activated
– Marker not active
– View A
– Test signal off
– Average not activated
– Max. HLD not activated
– Intens and Focus set to normal values (trace and readout
visible)
– 5 dB/Div not active
– Ref.-Level –20 dBm
– Instrument in Local mode (LED RM not lit)
2. Performance and Functional Tests
The following sections describe the checking procedures. The
values are specified in the data sheet “Specifications”. Additio-
nal introduction of errors caused by the measurement equip-
ment must be taken into account when adjusting the rated va-
lues. All measurements will be performed with an external 10
MHz reference frequency with a minimum accuracy of 1E-9.
2.2 Basic Performance Tests
2.2.1 Check of supply voltages
The supply voltages must be in the intended range for the in-
strument to operate properly. A great variety of malfunctions
may occur in case of incorrect supply voltages.
The 144V, 32V, 12V and –12V supplies can be measured on the
pins of the unused 8 pin molex connector [Photo] as indicated
in table x.x
Figure 2-1: 8pin connector for supply measurement
Pin1 144V
Pin6 32V
Pin7 12V
Pin8 -12V
(In earlier units this connector may have a ribbon cable at-
tached)
The 5 Volt supply voltage can be measured on the CPU-Board
5th pin of the supply voltage connector shown in Fig. 2-1.
+5 V
Figure 2-2: CPU board, showing the location for +5V
measurement.

13
Subject to change without notice
appear. Observe the voltage reading shown on upper right part
of CRT. Adjust this value to 1.50 volts using the rotary encoder.
Then select item „FOCUS“ in the internal adjustment menu
as described in section 2.2.1. Again, the screen contents will
be the same as described above. Adjust for best focus of the
center cross on CRT. Using the reduced intensity just chosen,
the focus will give a very precisely defined rendering of the 2
center cross lines.
Select item „INTENS“ in the internal adjustment menu as
described in section 2.2.1. Use the rotary encoder to adjust
the intensity voltage value on the CRT to the maximum value
of 5.10 volts. Check that the 2 center cross lines still have
the same width and are not out of focus, equalling or being
a fraction less in width compared to the width of the outer
rectangle lines.
2.2.4 Check of Dot-Join adjustment
Select item „TR-ROT“ in the internal adjustment menu as des-
cribed in section 2.2.1. A set of 6 lines will appear on the CRT,
forming a rectangle and a center cross. Also shown is a vertical
line 1.5 cm from the right vertical side line, which is 6 cm large
(see Fig. 2-3) and has highlighted points at each end.
The upper end point of the single vertical line is about half as
bright as the lower end point. Check that both points occupy
a small area only. The lower end point is in the form of a hori-
zontal line of about 1 millimetre of length.
Swith off the unit to leave the adjustment menu.
2.2.5 Check of TCXO and 3rd LO adjustment
The checking of TCXO (temperature compensated crystal oscil-
lator) frequency is extremely critical because it depends lar-
gely on the correct period of warmup with casing on the unit.
Incorrect temperature during checking will lead to possibly
incorrect values of TCXO frequency.
Set the HM5014-2 to the following:
RBW: 1 MHz
Center: 500 MHz
Span: Zero Span
Ref.-Level: -20dBm
ATT: 10 dB
(Max Hold, Average,Video filter, Marker and Tracking Ge-
nerator not activated)
Connect a 500 MHz, -30 dBm signal (unmodulated) to the RF
input of the HM5014-2, as shown in measurement setup 1. Un-
plug the SMB connector [CiC2] underneath the RFC board gently
with a pair of pliers [A6]. Then connect it via an adaptor [M6] and
a coaxial cable [M8] to the “A” input of the frequency counter, as
shown in measurement setup 2 (using option “B” connection of
the HM5014-2).
Figure 2-4: Illustration of CiC2 connector
2. Performance and Functional Tests
Enter the internal adjustment menu of the HM5014-2 by pres-
sing the keys “Intens” and “Focus” while switching on the ins-
trument. The time until the instrument emits a “beep” is about
10 seconds, then the 2 buttons can be released. Instead of the
standard screen display the adjustment “**menu**” display
will appear on the screen. The items
5dBADJ
TGL +1
TGL-10
OSCADJ
INTENS
FOCUS
TR-ROT
EEPNEW
appear on the screen, and to the left a cursor is shown. Items
can be elected by pressing the Center button for moving the
cursor upwards, and the Marker button for moving the cursor
downwards. Items are selected by pressing the Ref.-Level
button. The screen menu shown for each item is customized
for each adjustment operation. To leave the adjustment menu,
switch off the unit.
2.2.2 Check of CRT-XY Display adjustment
Select item „TR-ROT“ in the internal adjustment menu as des-
cribed in section 2.2.1. A set of 6 lines will appear on the CRT,
forming a rectangle and a center cross. Also shown is a verti-
cal line 1.5 cm from the right vertical side line, which is 6 cm
large and has highlighted points at each end.
Figure 2-3: Adjustment menu on CRT
The outer 4 lines forming the rectangle must be aligned exactly
along the outer perimeter of the CRT graticule, while the center
cross must be aligned with the 2 main axis of the graticule. De-
viations of up to 0.75 mm are permissible for the center cross
and up to 1 mm for the rectangle.
2.2.3 Check of CRT-Z Display and Focus adjustment
Select item „TR-ROT“ in the internal adjustment menu as des-
cribed in section 2.2.1. A set of 6 lines will appear on the CRT,
forming a rectangle and a center cross. Also shown is a verti-
cal line 1.5 cm from the right vertical side line, which is 6 cm
large and has highlighted points at each end.
This display must be without any extra points at any place in the
CRT area. Also the width of the horizontal and vertical center
lines should be equal to each other in the center area of the
CRT (astigmatism check).
Select item „INTENS“ in the internal adjustment menu as de-
scribed in section 2.2.1. The same screen contents as above will

14 Subject to change without notice
The frequency indicated on the frequency counter should be
29.300000 MHz, a deviation of ±150 Hz is permissible. Choose
a gate time of 2 seconds or greater for exact results. Note the
frequency value on a sheet of paper, it is needed for the next
step.
Now reconnect the SMB plug [CiC2] to the RFC board. Then
unplug the SMB plug from the IFA-Board, and connect it via
an adaptor[M6] and a coaxial cable [M8] to the “A” input of the
frequency counter, as shown in measurement setup II (using
option “C” connection of the HM5014-2).
The frequency indicated on the frequency counter should be
10.700000 MHz, a deviation of ±200 Hz is permissible. Choose
a gate time of 2 seconds or greater for exact results.
Now take the reading obtained earlier and add the new fre-
quency to the old value. The sum may not differ from 40.000000
MHz more than ±50 Hz.
2.2.6 Check of Amplitude adjustment
In order to check the amplitude adjustment, set the HM5014-2
to the following using measurement setup 1:
RB 1 MHz
Center 500 MHz
Span Zero Span
Ref.-Level -20 dBm
ATT 10 dB
Scale 10 dB/Div
Marker active
(Max Hold, Average, Video filter and Tracking Generator not
activated)
The synthesizer is set to the following:
Frequency 500 MHz
Amplitude -20 dBm
Output On
Modulation Off
Sweep Off
Now check that the level displayed is not more than 1 dB diffe-
rent than the level shown on the synthesizer when varying the
level from –20 dBm to –60 dBm. Errors can occur in absolute
position or in scaling.
While performing this measurement, do not vary the ATT set-
ting.
2.2.7 Check of RBW filters
In order to check the bandwidth and form factor of the 3 reso-
lution filters, use measurement setup 1 and set the HM5014-2
to the following:
RBW 1 MHz
Center 500 MHz
Span 5 MHz
Ref.-Level -20 dBm
ATT 10 dB
Scale 5 dB/Div
Marker active
Video filter active
(Max Hold, Average and Tracking Generator not activated)
The Synthesizer is set to the following (applies to all 3 filter
checks, except 9 kHz where the frequency is first set, then
varied):
Frequency 500 MHz
Amplitude -20 dBm
Output On
Modulation Off
Sweep Off
Set the marker to the left and right side of the filter response
shown, so that the marker level displayed is –26.0 dBm. Note
the 2 frequencies at these 2 points and subtract them. The dif-
ference obtained may be in the range of 700 kHz and 1200 kHz.
The HM5014-2 has the RBW values defined as the –6 dB points
to follow standard EMC bandwidth definitions.
Then change the settings:
RBW 120 kHz
Span 1 MHz
Repeat the procedure described above with this filter also, note
the 2 frequencies and subtract them. The result may be in the
range 90 – 140 kHz.
The measurement of the 9 kHz filter is accomplished using
measurement setup I, but a different approach is used to get
the bandwidth value.
Set the HM5014-2 to the following:
RBW 9 kHz
Center 500 MHz
Span Zero span
Ref.-Level -20 dBm
ATT 10 dB
Scale 5 dB/Div
Marker active
Video filter active
(Max Hold, Average and Tracking Generator not activated)
To get the 2 corner frequencies at (–6 dB), use the HM8134-3
with the rotary encoder active for setting the frequency of the
RF generator in steps of 100 Hz. Then vary the frequency until
the reading of the marker is –26 dBm, and note the frequencies
on both slopes of the 9 kHz filter at this point (the frequency is
displayed on the RF generator). Subtract the 2 obtained values,
the result may be in the range of 5.5 – 10 kHz.
2.2.8 Check of 5 dB/Div adjustment
In order to check the 5 dB/Div adjustment, use measurement
setup I and set the HM 8134-3 to the following:
Frequency 500 MHz
Amplitude -30 dBm
Output On
Modulation Off
Sweep Off
Select item „5dBADJ“ in the internal adjustment menu as
described in section 2.2.1. The “OSCCAL”-text will change to
“S10MHz”. Now switch through the ATT settings from 0 dB
to 40 dB and observe the location of the center of the trace
on the CRT. No marker function is available for this test. The
trace must change 2 graticule divisions for each attenuator
step, and the value for the 10 dB attenuator step may be in the
range of 1,6 to 2,4 graticule divisions from the top of the CRT
graticule grid.
Switch off the unit to leave the adjustment menu.
2.2.9 Check of test signal level
To check the test signal level, it is very important that a cor-
rect warmup of the instrument has taken place and that the
instrument is operated at the ambient temperature indicated
in the specifications of the HM5014-2.
Set the HM5014-2 to the following:
Center 48 MHz
Span Zero span
RBW 1 MHz
ATT 10 dB
Marker active
Test signal active
(Max Hold, Average, Video filter and Tracking Generator not
activated)
2. Performance and Functional Tests

15
Subject to change without notice
Connect coaxial cable [M8 + adaptor M11] to the test signal out-
put and to the RF input of the HM5014-2. The marker reading
may be in the range of –27.0 dBm to –33.0 dBm.
2.2.10 Check of TG amplitude adjustment
To check the adjustment of TG amplitude, set the HM5014-2
to the following:
Center 500 MHz
RBW 1 MHz
Span Zero Span
ATT 40 dB
Ref.-Level +10 dBm
Marker Active
TG Active
TG Level +1 dBm
(Max Hold, Average and Video filter not activated)
Observe the marker level displayed on the CRT, and compare
the displayed level to the level shown on the readout. Vary the
level from +1 dBm to –10 dBm and check the marker readout
vs. the TG level readout.
Now set the ATT to, 30, 20, 10 and 0 dB while setting the TG level
from –10, -20, -30 and –40 dBm to minimum, so that the reading
of the marker value stays in the same major graticule division
on the CRT for best precision of the marker values.
The difference between readout of TG level and readout of mar-
ker level may not exceed 3 dB in either direction.
2.2.11 Full Band Amplitude check
To check the amplitude flatness of the entire frequency range,
set the HM5014-2 to the following:
Center 500 MHz
Span 1000 MHz
RBW 1000 kHz
ATT 10 dB
Ref.-Level -20 dBm
Max Hold Active
Marker Active
(Tracking Generator, Average and Video filter not activa-
ted)
Then set the following on the RF Generator [M1] using mea-
surement setup 1
Amplitude -30 dBm
Modulation Off
Freq. Step 1 MHz
and manually or automatically set all frequencies from 1
MHz to 1000 MHz.
The result on screen will be a line centered around the 2nd
graticule line from the top.
Now repeat this test with a Center frequency setting of 550
MHz, and initialize the screen anew to use a “fresh” Max Hold
screen. This will allow testing also to 1050 MHz.
Differences up to ±2 dB in the above measurements are per-
mitted when measuring along the line using the marker.
For higher precision of the result, the generator should be
measured first with a power meter connected to the end of the
connection to the spectrum analyzer, thus establishing the va-
lues for a correction table for the generator. These values have
to be taken into account when evaluating a precise pass/fail
decision (see measurement setup 3).
2.2.12 Check of Audio Output
To check the audio output of the HM5014-2, connect a set of PC
speakers to the audio output of the HM5014-2. Set the HM5014-
2 to the following:
Center 500 MHz
Span 1000 MHz
RBW 1000 kHz
ATT 10 dB
Ref.-Level -20 dBm
(Tracking Generator, Average, Max Hold and Video filter not
activated)
and set the phones level so that a noise output signal can be
obtained, broken by small pauses when the instrument pre-
pares for the next sweep.
2.2.13 Check of Probe Power
To check the correct function of the probe power supply,
connect special cable [A8] to the probe power output of the
HM5014-2. Connect the other end to a digital multimeter [M10],
red to positive input, black to negative. The voltage measured
must range between 5.7 and 6.3 Volts
2.2.14 Check of Attenuator
To check the attenuator of the HM5014-2, use measurement
setup I.
In order to get best test results, this test should be executed
3 times at frequencies of 10 MHz, 500 MHz and 1000 MHz. Set
the HM5014-2 to the following:
Center set to frequency chosen for test (see above)
Span Zero span
RBW 1000 kHz
Ref. Level depends on ATT
Marker Active
Video filter Activate where needed
Now set the Generator to the desired measurement frequency
and set an output level of –30 dBm.
The marker readout will show this level independent of the loca-
tion on the CRT, which will vary with the ATT setting chosen. The
readout may not vary less than 8 dB and not more than 12 dB
from setting to next setting over the entire frequency range (not
more than 2 dB deviation from 10 dB nominal attenuation)
2. Performance and Functional Tests

16 Subject to change without notice
3.1 Preliminary Instructions
To ensure proper conditions for the adjustment and to prevent
settings errors, the instrument must be prepared as follows:
– Allow a minimum warm-up time of 30 minutes at ambient
temperature (unit must be inside casing)
– Switch off the HM5014-2 and then switch it on again
– Set the HM5014-2 to the following:
– Center frequency 500 MHz
– Span 1000 MHz
– ATT 10 dB
– TG off
– RBW 1000 kHz
– VBW not activated
– Marker not active
– View A
– Test signal off
– Average not activated
– Max. HLD not activated
– Intens and Focus set to normal values (trace and readout
visible)
– 5 dB/Div not active
– Ref.-Level –20 dBm
– Instrument in Local mode (LED RM not lit)
The following sectins describe the adjustment procedures.
The values are specified in the data sheet “Specifications”.
Additional introduction of errors caused by the measurement
equipment must be taken into account when adjusting the rated
values. All measurements will be performed with an external 10
MHz reference frequency with a minimum accuracy of 10-9.
3.2 Adjustments
3.2.1 Adjustment of supply voltages
The supply voltages must be in the intended range for the in-
strument to operate properly. A great variety of malfunctions
may occur in case of incorrect supply voltages.
The 144V, 32V, 12V and –12V supplies can be measured on the
pins of the unused 8 pin molex connector as indicated beow.
Figure 3-1: 8pin connector for supply measurement
Pin1 144V
Pin6 32V
Pin7 12V
Pin8 -12V
(In earlier units this connector may have a ribbon cable at-
tached)
+5 V
Figure 3-2: CPU board, showing the location for +5V
measurement.
The 5 Volt supply voltage can be measured on the CPU-Board
5th pin of the supply voltage connector shown in Fig. 3-2.
Adjustment of the voltages is made at the factory, in the very
unlikely event of having to readjust them, use RV1001 [indicated
in Fig. 3-3 below] to adjust the +144 Volts, and then use RV1003
to adjust the +12 and –12 Volts supplies. No other adjustments
are necessary at this point.
Figure 3-3: Location of RV1001
Enter the internal adjustment menu of the HM5014-2 by pres-
sing the keys “Intens” and “Focus” while switching on the ins-
trument. The time until the instrument emits a “beep” is about
10 seconds, then the 2 buttons can be released. Instead of the
standard screen display the adjustment “**menu**” display
will appear on the screen. The items
5dBADJ
TGL +1
TGL-10
OSCADJ
INTENS
FOCUS
TR-ROT
EEPNEW
appear on the screen, and to the left a cursor is shown. Items
can be elected by pressing the Center button for moving the
cursor upwards, and the Marker button for moving the cursor
downwards. Items are selected by pressing the Ref.-Level
button. The screen menu shown for each item is customized
for each adjustment operation. To leave the adjustment menu,
switch off the unit.
3.2.2 Check of CRT-XY Display adjustment
Select item „TR-ROT“ in the internal adjustment menu as de-
scribed in section 2.2.1. A set of 6 lines will appear on the CRT,
3. Adjustment
RV1001
3. Adjustment
RV1003
RV1005

17
Subject to change without notice
forming a rectangle and a center cross. Also shown is a verti-
cal line 1.5 cm from the right vertical side line, which is 6 cm
large and has highlighted points at each end.
Figure 3-4: Adjustment menu on CRT
The outer 4 lines forming the rectangle must be aligned ex-
actly along the outer perimeter of the CRT graticule, while the
center cross must be aligned with the 2 main axis of the grati-
cule. Deviations of up to 1 mm are permissible, the main axis
permissible deviation is 0.75 mm.
To adjust the CRT display, use RV3 on XYZ board (see Fig. 3-
5) to adjust X-amplitude, P2 (see Fig 3-5) to adjust X-position.
Use P5 to adjust Y-position and P7 to adjust Y-amplitude. P2,
P5 and P7 are located on CPU-Board (see Fig. 3-5).
3.2.3 Adjustment of CRT-Z Display and Focus
Select item „TR-ROT“ in the internal adjustment menu as
described in section 2.2.1. A set of 6 lines will appear on the
CRT, forming a rectangle and a center cross. Also shown is a
vertical line 1.5 cm from the right vertical side line, which is 6
cm large and has highlighted points at each end.
This display must be without any extra points showing at any
place in the CRT area. Adjust the intensity setting with RV1 on
XYZ-board so that the extra points are not visible, but the rest
of the picture is. Also the width of the horizontal and vertical
center lines should be equal to each other in the center area
of the CRT (astigmatism check). Optimize the representation
of the lines using RV2 on XYZ-board.
Select item „FOCUS“ in the internal adjustment menu as des-
cribed in section 3.2.1. Set the value displayed on screen to
2.50 V using the rotary encoder. Now very carefully using an
isolated tool made entirely of plastic or ceramic adjust the Po-
tentiometer RV1005 (see Fig. 3-3) on the PS-board right next
to the XYZ-board for best focused traces on screen. If you pre-
fer working with the unit not in operation, adjust the RV1005
to a new value when the unit is switched off, and switch it on
to check, pressing only Focus button longer to get the normal
3. Adjustment
Figure 3-5: Illustration of adjustment locations
RV1
RV2 RV3
P9
P8
P3
P6
P7
P5 P4 P1
P2
TCXO
P10
(below 2nd cover)

18 Subject to change without notice
TR-ROT screen, and there compare which setting is best, and
switch off again before next setting.
Select item „INTENS“ in the internal adjustment menu as de-
scribed in section 2.2.1. The same screen contents as above will
appear. Observe the voltage reading shown on upper right part
of CRT. Adjust this value to 1.50 volts using the rotary encoder.
Then select item „FOCUS“ in the internal adjustment menu
as described in section 2.2.1. Again, the screen contents will
be the same as described above. Adjust for best focus of the
center cross on CRT. Using the reduced intensity just chosen,
the focus will give a very precisely defined rendering of the 2
center cross lines.
Select item „INTENS“ in the internal adjustment menu as de-
scribed in section 2.2.1. Use the rotary encoder to adjust the
intensity voltage value on the CRT to the maximun value of 5.10
volts. Check that the 2 center cross lines still have the same
width and are not out of focus, equalling or being a fraction
less in width compared to the width of the outer rectangle
lines. Adjust P3 on CPU-board for best representation of fo-
cus at full intensity. P6 is preset at the factory and does not
need to be touched.
3.2.4 Adjustment of Dot-Join
Select item „TR-ROT“ in the internal adjustment menu as de-
scribed in section 2.2.1. A set of 6 lines will appear on the CRT,
forming a rectangle and a center cross. Also shown is a verti-
cal line 1.5 cm from the right vertical side line, which is 6 cm
large and has highlighted points at each end.
The upper end point of the single vertical line is about half as
bright as the lower end point. Check that both points occupy
a small area only. The lower end point is in the form of a hori-
zontal line of about 1 millimetre of length.
Adjust this vertical line for best representation using P1 for X
adjustment and P4 for Y adjustment. Both are located on CPU-
board (see Fig. 3-5)
After adjustment, the representation of the CRT should look
like the screen in Fig. 2-2. Swith off the unit to leave the ad-
justment menu.
3.2.5 Adjustment of TCXO and 3rd LO
The checking of TCXO (temperature compensated crystal oscil-
lator) frequency is extremely critical because it depends lar-
gely on the correct period of warmup with casing on the unit.
Incorrect temperature during checking will lead to possibly
incorrect values of TCXO frequency.
Set the HM5014-2 to the following:
RBW 1 MHz
Center 500 MHz
Span Zero Span
Ref.-Level -20dBm
ATT 10 dB
(Max Hold, Average,Video filter, Marker and Tracking Ge-
nerator not activated)
Connect a 500 MHz, -30 dBm signal (unmodulated) to the RF
input of the HM5014-2, as shown in measurement setup 1.
Unplug the SMB connector [CiC2] underneath the RFC
board gently with a pair of pliers[A6]. Then connect it via an
adaptor[M6] and a coaxial cable [M8] to the “A” input of the
frequency counter, as shown in measurement setup 2 (using
option “B” connection of the HM5014-2) (see Fig. 3-4).
3. Adjustment
Figure 3-6: Illustration of CiC2 connector
The frequency indicated on the frequency counter should be
29.300000MHz, adeviationof±10 Hz is permissible. Choose agate
time of 2 seconds or greater for exact results. To adjust the fre-
quency, open the cover of the CPU-board (see Fig. 3-5) by remo-
ving the 7 countersunk screws indicated, then remove the screw
left over to open the cover on the right side of the CPU-board
(as seen from the front), remove the protective label, and use a
ceramic screwdriver [A1] or [A2] (depends on slot type) to adjust
the frequency to 29.300000 MHz ±2Hz. Place a new label on the
tuning hole of the TCXO. Close the cover of the TCXO part again,
then replace the CPU-board cover. Fit all screws in place.
Now reconnect the SMB plug [CiC2] to the RFC board. Then
unplug the SMB plug from the IFA-Board, and connect it via
an adaptor[M6] and a coaxial cable [M8] to the “A” input of the
frequency counter, as shown in measurement setup II (using
option “C” connection of the HM5014-2).
The frequency indicated on the frequency counter should be
10.700000 MHz, a deviation of ±15 Hz is permissible. Choose a
gate time of 2 seconds or greater for exact results. To adjust
the frequency, open the cover of the RFC box (the smaller box
in IF-unit) and use a ceramic screwdriver to adjust the frequen-
cy to 10.700000 Hz ±5 Hz (keeping in mind a possible deviation
introduced by the TCXO). Close the cover of RFC box and fix it
with the screw.
3.2.6 Check of Amplitude adjustment
In order to check the amplitude adjustment, set the HM5014-2
to the following using measurement setup 1:
RBW 1 MHz
Center 500 MHz
Span Zero Span
Ref.-Level -20 dBm
ATT 10 dB
Scale 10 dB/Div
Marker active
(Max Hold, Average, Video filter and Tracking Generator not
activated)
The synthesizer is set to the following:
Frequency 500 MHz
Amplitude -20 dBm
Output On
Modulation Off
Sweep Off
Now check that the level displayed is not more than 1 dB diffe-
rent than the level shown on the synthesizer when varying the

19
Subject to change without notice
3. Adjustment
level from –20 dBm to –60 dBm. Errors can occur in absolute
position or in scaling.
STOP
While performing this measurement, do not vary
the ATT setting.
Adjustment is best done setting the HM 8134-3 to a step of 20
dB, and varying the amplitude fom –20 dBm to –40 and –60
dBm, observing the marker level displayed on the CRT. Use P8
(see Fig. 3-5) to set the steps to 20 dB each, and P9 to set the
absolute position. When done, check in 10 dB-increments and
repeat the adjustment procedure if necessary.
3.2.7 Adjustment of RBW filters
The RBW filters of the HM5014-2 are not to be adjusted by ser-
vice personnel. This process is very complicated and delicate
and the chances of positive outcome are very slim. If the filters
have become defective, the only remedy is to change the IF Unit
against a working unit. This is described in chapter 5.
3.2.8 Adjustment of 5 dB/Div
In order to check the 5 dB/Div adjustment, use measurement
setup I and set the HM 8134-3 to the following:
Frequency 500 MHz
Amplitude -30 dBm
Output On
Modulation Off
Sweep Off
Select item „5dBADJ“ in the internal adjustment menu as
described in section 3.2.1. The “OSCCAL”-text will change to
“S10MHz”. Now switch through the ATT settings from 0 dB
to 40 dB and observe the location of the center of the trace
on the CRT. No marker function is available for this test. The
trace must change 2 graticule divisions for each attenuator
step, and the value for the 10 dB attenuator step may be in the
range of 1,6 to 2,4 graticule divisions from the top of the CRT
graticule grid.
For adjustment of the 5 dB/Div setting, set the distance on CRT
exactly to 2 cm from the top of the graticule using the rotary
encoder. Switch off the unit to leave the adjustment menu.
3.2.9 Adjustment of test signal level
To check the test signal level, it is very important that a cor-
rect warmup of the instrument has taken place and that the
instrument is operated at the ambient temperature indicated
in the specifications of the HM5014-2.
Set the HM5014-2 to the following:
Center 48 MHz
Span Zero span
RBW 1 MHz
ATT 10 dB
Marker active
Test signal active
(Max Hold, Average, Video filter and Tracking Generator not
activated)
Connect coaxial cable [M8] using [M11] to the test signal output
and to the RF input of the HM5014-2. The marker reading may
be in the range of –27.0 dBm to –33.0 dBm.
Adjustment of the test signal level is done by connecting the test
signal to the RF input of the HM5014-2, adjusting the marker
readout exactly to –30 dBm. The Potentiometer P10 under the
shield of the DDS part of the CPU-board is used to set the test
signal to the level of –30 dBm (see Fig. 3-5).
3.2.10 Adjustment of TG amplitude
To check the adjustment of TG amplitude, set the HM5014-2
to the following:
Center 500 MHz
RBW 1 MHz
Span Zero Span
ATT 40 dB
Ref.-Level +10 dBm
Marker Active
TG Active
TG Level +1 dBm
(Max Hold, Average and Video filter not activated)
Observe the marker level displayed on the CRT, and compare
the displayed level to the level shown on the readout. Vary the
level from +1 dBm to –10 dBm and check the marker readout
vs. the TG level readout.
Now set the ATT to, 30, 20, 10 and 0 dB while setting the TG level
from –10, -20, -30 and –40 dBm to minimum, so that the reading
of the marker value stays in the same major graticule division
on the CRT for best precision of the marker values.
The difference between readout of TG level and readout of mar-
ker level may not exceed 3 dB in either direction.
Adjustment of the TG level is accomplished using the internal
adjustment menu (see 2.2.1). Use a coaxial cable [M5] to con-
nect the TG output to the RF input. Activate the item “TGL +1”
and adjust the trace in centre of the screen to 1 mm above the
second graticule line from the top, ATT of the receiver must be
set to 40 dB (ref.-level of +10 dBm). Adjust the level using the
rotary encoder. Then choose the menu item “TGL-10”, set the
ATT of the receiver to 30 dB, and place the trace in the centre of
the screen exactly on top of the second graticule line from the
top. Using the same position on the CRT assures no extra errors
introduced by the signal processing path of the HM5014-2.
After completing the adjustment, leave the menu by switching
off the HM5014-2. Then check the level adjustment as descri-
bed in para. 2.2.10.
3.2.11 Full band amplitude check
There is no adjustment possible in case the full band amplitude
check in 2.2.11 is not passed. Refer to chapter 4 for trouble-
shooting and chapter 5 for repair of the unit.

20 Subject to change without notice
4. Troubleshooting of the HM5014-2
STOP
Caution: Security advice!
The following procedures assume that the
HM5014-2 is connected to mains /line via a safe-
ty transformer. Only qualified personnel who are
aware of the danger of electricity should execute
the following procedures.
If cables or connectors have to be disconnected, the instrument
must be switched off before removing. Before continuing, ob-
serve the remarks in chapter 2.1 “Test instructions”.
See paragraph 5.1 “Opening the instrument” how to remove
the rear cover and the casing of the instrument.
Item Behaviour of the HM5014-2 Possible cause / What to do Remark
1.1 No front panel LED light, no trace
and no readout visible on the CRT
(dark screen)
Blown fuse: Pull out fuse holder at the
rear and check the fuse. If blown, re-
place with same rating only and switch
the instrument on again. If the fuse is
intact, continue with item 1.2
The instrument must be disconnected
from mains / line before changing the
fuse.
1.2 LEDs will flash one short time,
nothing else happens
Power supply detects overload Continue to isolate fault, execute 1.3 to 1.6
1.3 Pull KEY conn Does the CRT light up (will display an
error message) ?
Short on KEY Board – replace board and
repeat test 1.2
1.4 Pull XYZ conn Do the LEDs on the KEY Board light up
(CRT is not active) ?
Short around XYZ-Board – replace board,
and repeat test 1.2
1.5 Pull CPU conn Measure the voltages on the cable. Replace CPU Board and repeat test 1.2
1.6 Pull IF-Unit conn Does CRT light up? Replace IF-unit.
2.1 Check amplitude at “1”, must be
–31 dBm
Attenuator malfunction, replace ATT 1 thru 3 are the hex marks in the block
diagram
2.2 Check amplitude at “2”, must be
–15 dBm (±3 dB), frequency 29,7
MHz for center peak
RF Box malfunction, replace RF Box
2.3 Check amplitude at ”3”, must be
–14 dBm (±3dB), frequency 10,7
MHz for center peak
IF Unit malfunction, replace IF unit
3.1 Filters not equal in amplitude IF Unit defective, replace IF unit
3.2 No noise on baseline Replace IF Unit as a test, if still no sig-
nal, replace CPU Board
Digitization working, but no signal voltage
applied
Interface not responding Replace interface Board
No probe power Replace KEY Board Voltage regulator is located on KEY Board
4.1 RF ampl has dropped Perform checks 2.2 to 2.4 to determine

cause, follow instructions
Possible ATT, RF Box, IF Unit faulty
4.2 RF ampl not linear Perform checks 2.2 to 2.3 to determine
cause, follow instructions
Possible ATT, RF Box faulty
4.3 Full band ampl check fails Perform checks 2.2 to 2.3 to determine
cause, follow instructions
Possible ATT, RF Box faulty
5.1 No TG sig Replace TG Board and test if error per-
sists, check connection to CPU Board
and RF Box, switch TG ATT in 10 dB
steps and listen for sound of relays
Also check the connectors to TG Board. Is
it powered?
6.1 No test sig Replace CPU Board as test, check ca-
ble to jack
The signal is derived from the 96 MHz sig-
nal on CPU Board
7.1 No audio Replace KEY Board Is the jack damaged?
4. Troubleshooting of the HM5014-2
Other manuals for HM5014-2
2
Table of contents
Other Hameg Measuring Instrument manuals

Hameg
Hameg CombiScope HM1508-2 User manual

Hameg
Hameg HM5033 User manual

Hameg
Hameg HM5010 User manual

Hameg
Hameg HM5012-2 User manual

Hameg
Hameg HM8118 User manual

Hameg
Hameg hm5510 User manual

Hameg
Hameg HM 8027 User manual

Hameg
Hameg CombiScope HM1508-2 User manual

Hameg
Hameg HM8014 User manual

Hameg
Hameg HZ547 User manual