ADTEK AFM-8A User manual

AFM-8A
High Performance Power Analyzer
Rev 1.0
2023-02-22
Operation Manual
II
CopyRight ©
This manual is copyrighted.
Without the written permission of the Company, any of the paragraphs and chapters of
this manual shall not be extracted, copied or reproduced and transmitted in any form, or all
consequences shall be borne by the offender.
The Company reserves all legal rights.
The Company reserves the right to make changes to the specifications described in this
manual without prior notice. Please keep attention to the latest specifications of our official
website.
Safety warning
Please read this manual carefully before installing, operating or maintaining this
equipment. Please note the following special signs appearing in this manual or on
the device, which are used to warn of potential hazards or to interpret and specify the
operating procedures.
The presence of such safety signs indicates that there is a danger of
electricity, and failure to follow certain instructions will result in personal injury.
This is a safety warning sign that warns of the risk of potential personal injury.
Please follow all the safety information after this mark to avoid possible injury
or death.
The sign for the reminder, to avoid the operation due to inadvertently caused
the instrument can not work or even damage the instrument or cause harm to
the person.
The equipment must be turn offall power supplying and grounded before maintenance
and overhaul.
Maintenance only work by qualified personnel.
This manual applies to persons who have been trained to use. The company are not
responsible for any problems arising out of their abnormal use.

III
Table of Contents
Chapter 1. Meter overview...................................................................1
1.1 AFM-8A series function introduction.......................................................... 1
1.2 AFM-8A series product features ................................................................ 2
1.3 AFM-8A series applications ....................................................................... 3
Chapter 2 Installation...........................................................................4
2.1 Exterior and dimensions............................................................................ 4
2.2 Meter installation ....................................................................................... 4
2.3 Meter connections and wiring.................................................................... 4
Chapter 3 Meter display and operation .............................................9
3.1 Meter panel................................................................................................ 9
3.2 Display screen and operation buttons description..................................... 9
3.2.1 Operation buttons .............................................................................. 10
3.2.2 Symbol icons in main screen............................................................. 10
3.3 Measurement data display and key operation..........................................11
3.4 Max/Min data display and key operation ................................................. 15
3.5 Demand data display and key operation ................................................. 15
3.6 Harmonic data display and key operation ............................................... 16
3.7 Phasor diagram display and key operation ............................................. 17
3.8 Waveform display and key operation ...................................................... 17
3.9 Time of use (TOU) data display and key operation ................................. 18
3.10 Event logging display and key operation............................................... 18
3.11 Meter information and key operation ..................................................... 19
3.12 Setting display and key operation ......................................................... 19
3.12.1 Password input ................................................................................ 19
3.12.2 Parameter setting ............................................................................ 19
3.12.3 Setting menu list .............................................................................. 20
3.12.4 Parameter setting input key operation............................................. 23
3.12.5 Back to main page........................................................................... 23
Chapter 4 Detailed functions description .......................................24
4.1 Basic Measurements............................................................................... 24
4.1.1 Demand ............................................................................................. 24
4.1.2 Energy measurements ...................................................................... 25
4.1.3 Auto wire change ............................................................................... 25
4.2 MAX/MIN ................................................................................................. 26
4.3 Harmonics and Power Quality Analysis................................................... 27
4.3.1 Harmonics ......................................................................................... 27
4.3.2 Phase angle....................................................................................... 27
4.3.3 Unbalance analysis ........................................................................... 27
4.4 Event logging function ............................................................................. 27

IV
4.4.1 Setting of single event logging function ............................................. 27
4.4.2 Event logging function enable ........................................................... 28
4.4.3 Event log read ................................................................................... 28
4.5 Relay function.......................................................................................... 29
4.5.1 Alarm function setting ........................................................................ 30
4.5.2 Alarm function enable ........................................................................ 30
4.5.3 Alarm records read ............................................................................ 30
4.6 Digital input(DI) function .......................................................................... 31
4.6.1 DI function setting.............................................................................. 31
4.7 Analog output(AO) function ..................................................................... 32
4.7.1 AO function setting ............................................................................ 32
4.8 Pulse output(PO) function ....................................................................... 33
4.8.1 PO function setting ............................................................................ 34
4.9 Data logging function............................................................................... 34
4.9.1 Data logging function setting ............................................................. 34
4.9.2 Data log read ..................................................................................... 36
4.10 Time of use (TOU) function ................................................................... 37
4.10.1 Season setting................................................................................. 37
4.10.2 TOU season format ......................................................................... 37
4.10.3 Schedule setting .............................................................................. 37
4.10.4 Segment setting............................................................................... 38
4.10.5 Tariffsetting ..................................................................................... 38
4.10.6 Holiday setting ................................................................................. 38
4.11 Power quality event logging and Waveform capture ............................. 39
4.11.1 Event logging data format, see Table 4-11....................................... 40
4.11.2 Logging events ................................................................................ 40
4.11.3 Event logging triggering conditions.................................................. 40
4.11.4 Event log retrieve............................................................................. 42
4.11.5 Waveform capture data format ........................................................ 42
4.11.6 Waveform capture group ................................................................. 42
4.11.7 Waveform capture triggering condition ............................................ 43
4.11.8 Waveform capture retrieve............................................................... 44
4.12 Communication function........................................................................ 45
4.12.1 The first port of RS-485 communication .......................................... 45
4.12.2 The second port of RS-485 communication .................................... 46
4.12.3 Ethernet communication.................................................................. 46
4.13 Expansion DIO module function............................................................ 47
4.13.1 DIO expansion module setting ........................................................ 47
4.13.2 DIO expansion module read and control ......................................... 48

1
1.1 AFM-8A series function introduction
Chapter 1. Meter overview
This is a powerful multifunction power meter
AFM-8A series is a powerful multifunction power meter, designed by high-speed
microprocessors and advanced signal processing technology. With three-phase power
measurement, display, power accumulation, power quality analysis, event logging, power
quality event logging, waveform record, TOU and network communications functions. 3.5-
inch high-definition color TFT-LCD display provides a variety of data display, so you can
easily read the measurement data. User-friendly display and operation method allows
users to easily operate without having to find the manual at any time.
Perfect choice for power SCADA system
AFM-8A series can be used as a stand alone meter, but also can be a power monitoring
system (SCADA) of the front-end devices, through a variety of communication interface for
remote data collection and control. The industry standard RS-485 communication interface
and MODBUS communication protocol, as well as Ethernet and MODBUS TCP / IP
protocol makes the network easy and convenient, is the perfect choice for SCADA system
integration.
Energy management
AFM-8A series can calculate bidirectional and four-quadrant active power and reactive
power accumulation, as well as the maximum / minimum value of the parameters and
demand calculation function, with the system software can help users to measurement the
energy consumption of each circuit loop and load trends.
Remote control
AFM-8A series is not only a measurement meter, in addition to includ DI, relay output
and AO interface, also can via second RS-485 port to connect expansion DIO modules, to
achieve flexible I / O function, become a powerful discrete RTU system.
Analysis of power quality
AFM-8A series using digital signal processing technology, it can real-time measurement
the phase voltage and current total harmonic distortion (THD), individual harmonic (2-63rd),
voltage and current unbalance.
Data logging function
The AFM-8A series provides 4MB flash RAM for data storage, it's recording the specified
parameters on a regular time. Internal with high-precision real-time clock, each record with
a timestamp.
Time of use function(TOU)
The AFM-8A series has a powerful TOU function and up to 5 years of holiday setting
function. The user can be based on the local TOU price to settings for achieve energy
cumulative calculation.

2
Power quality event logging
AFM-8A series in the voltage sag, swell and over current events occur, will record the
time of the incident and the trigger conditions. It's up to 50,000 records of power quality
events.
Waveform records
AFM-8A series can record 8 groups of each phase voltage and current waveform data,
each cycle has 64 points sampling data of the record, the meter can record before and
after the 8 cycle waveform data from trigger conditions establish. The trigger conditions
can be setting by user, it's provided the data for power quality analyze.
1.2 AFM-8A series product features
Multi-function, high precision
AFM-8A multifunction meter series has a powerful data collection and processing ability,
can measure many power parameters, and demand calculation, harmonic analysis,
maximum / minimum values, event alarm, energy accumulation, data logging , TOU
function, power quality event logging and waveform recording.
Voltage and current measurement accuracy is 0.1%, power is 0.25% and energy is 0.5%.
Compact design, easy installation
The dimensions of the AFM-8A series conform to the IEC standard 92mm DIN square
shape, and thickness only 82mm. Installation by self-locking buckles without screws,
installation or removal are very convenient.
Intuitive display, easy to learn and use
3.5-inch large screen, high-brightness LCD display, the screen clear and the content
intuitive, easy to learn and use. All measurement data can be easily read through the panel
keys operation, the parameters can be set by the panel keys, also can be written by the
communication. The parameters setting and accumulated values are stored in the FRAM,
even if the power down is not lost. LCD brightness can be adjusted, and standby screen
brightness also can be set, allowing you to use in different environments.
Wiring flexible and convenient
Whether the system is high or low voltage, and whether it is single-phase or three-phase
, you can choose the appropriate wiring to meter connection. AFM-8A series support
multiple wiring method, can cover all the power system applications.
Safety, high reliability
AFM-8A series with multiple isolation and anti-interference design, can operating in high-
interference environment. The meter also approved by CE certification and IEC standards
of EMC testing.

3
1.3 AFM-8A series applications
• Energy management system
• Industry automation
• Power monitoring
• Power grid automation
• Intelligent Building
• Intelligent switchboard, switchgear
• Substation automation

4
2AO+4DI+4RO 2AO+8DI
2AO+4DI+4RO+LAN 2AO+8DI+LAN
Chapter 2 Installation
2.1 Exterior and dimensions
2.2 Meter installation
2.3 Meter connections and wiring
Terminal block

5
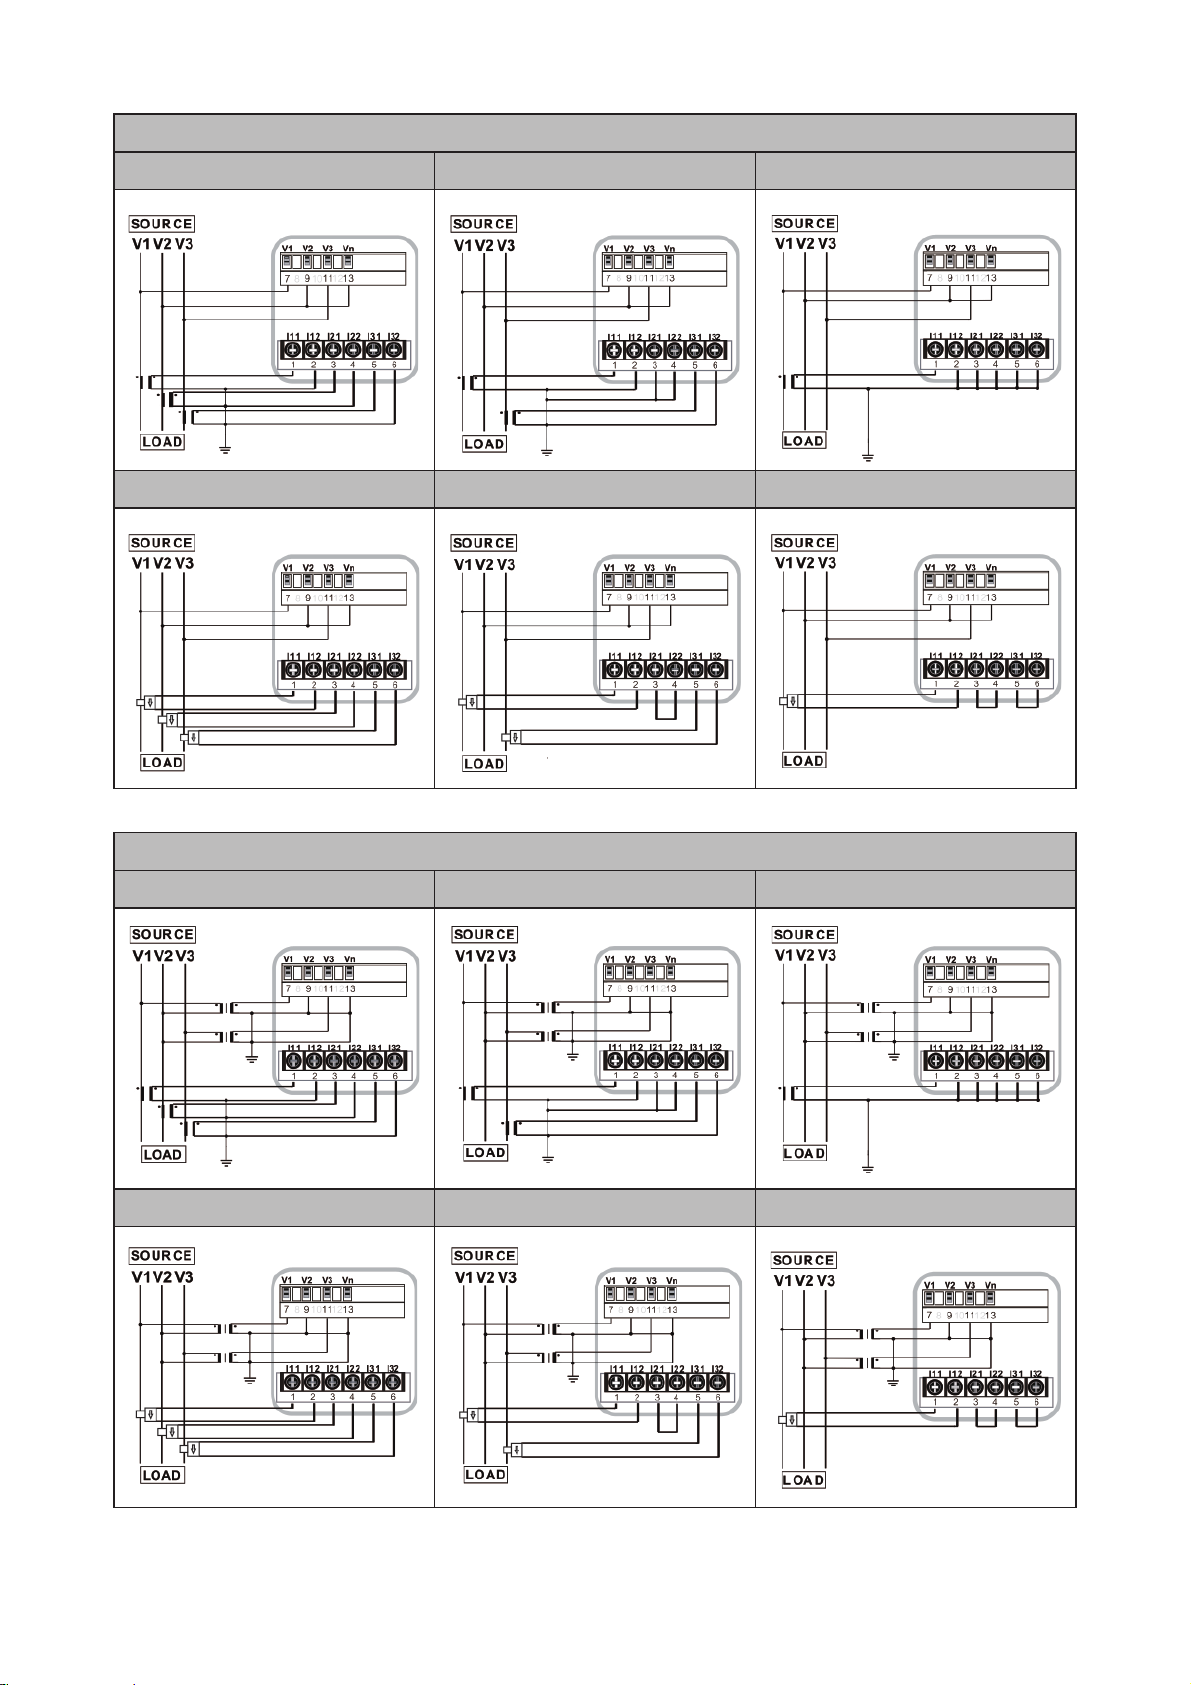
1 Phase
1P2W(0~1A/5A) 1P3W(0~1A/5A)
1P2W(0~333mV) 1P3W(0~333mV)
Voltage and current wiring (CT secondary side distinguishes 1A/5A and 333mV)
6
3P3W w/o PT
3CT(0~1A/5A) 2CT(0~1A/5A) 1CT(0~1A/5A)
3CT(0~333mV) 2CT(0~333mV) 1CT(0~333mV)
3P3W 2PT
3CT(0~1A/5A) 2CT(0~1A/5A) 1CT(0~1A/5A)
3CT(0~333mV) 2CT(0~333mV) 1CT(0~333mV)

7
3P4W w/o PT
3CT(0~1A/5A) 1CT(0~1A/5A)
3CT(0~333mV) 1CT(0~333mV)
3P4W 3PT
3CT(0~1A/5A) 1CT(0~1A/5A)
3CT(0~333mV) 1CT(0~333mV)
8
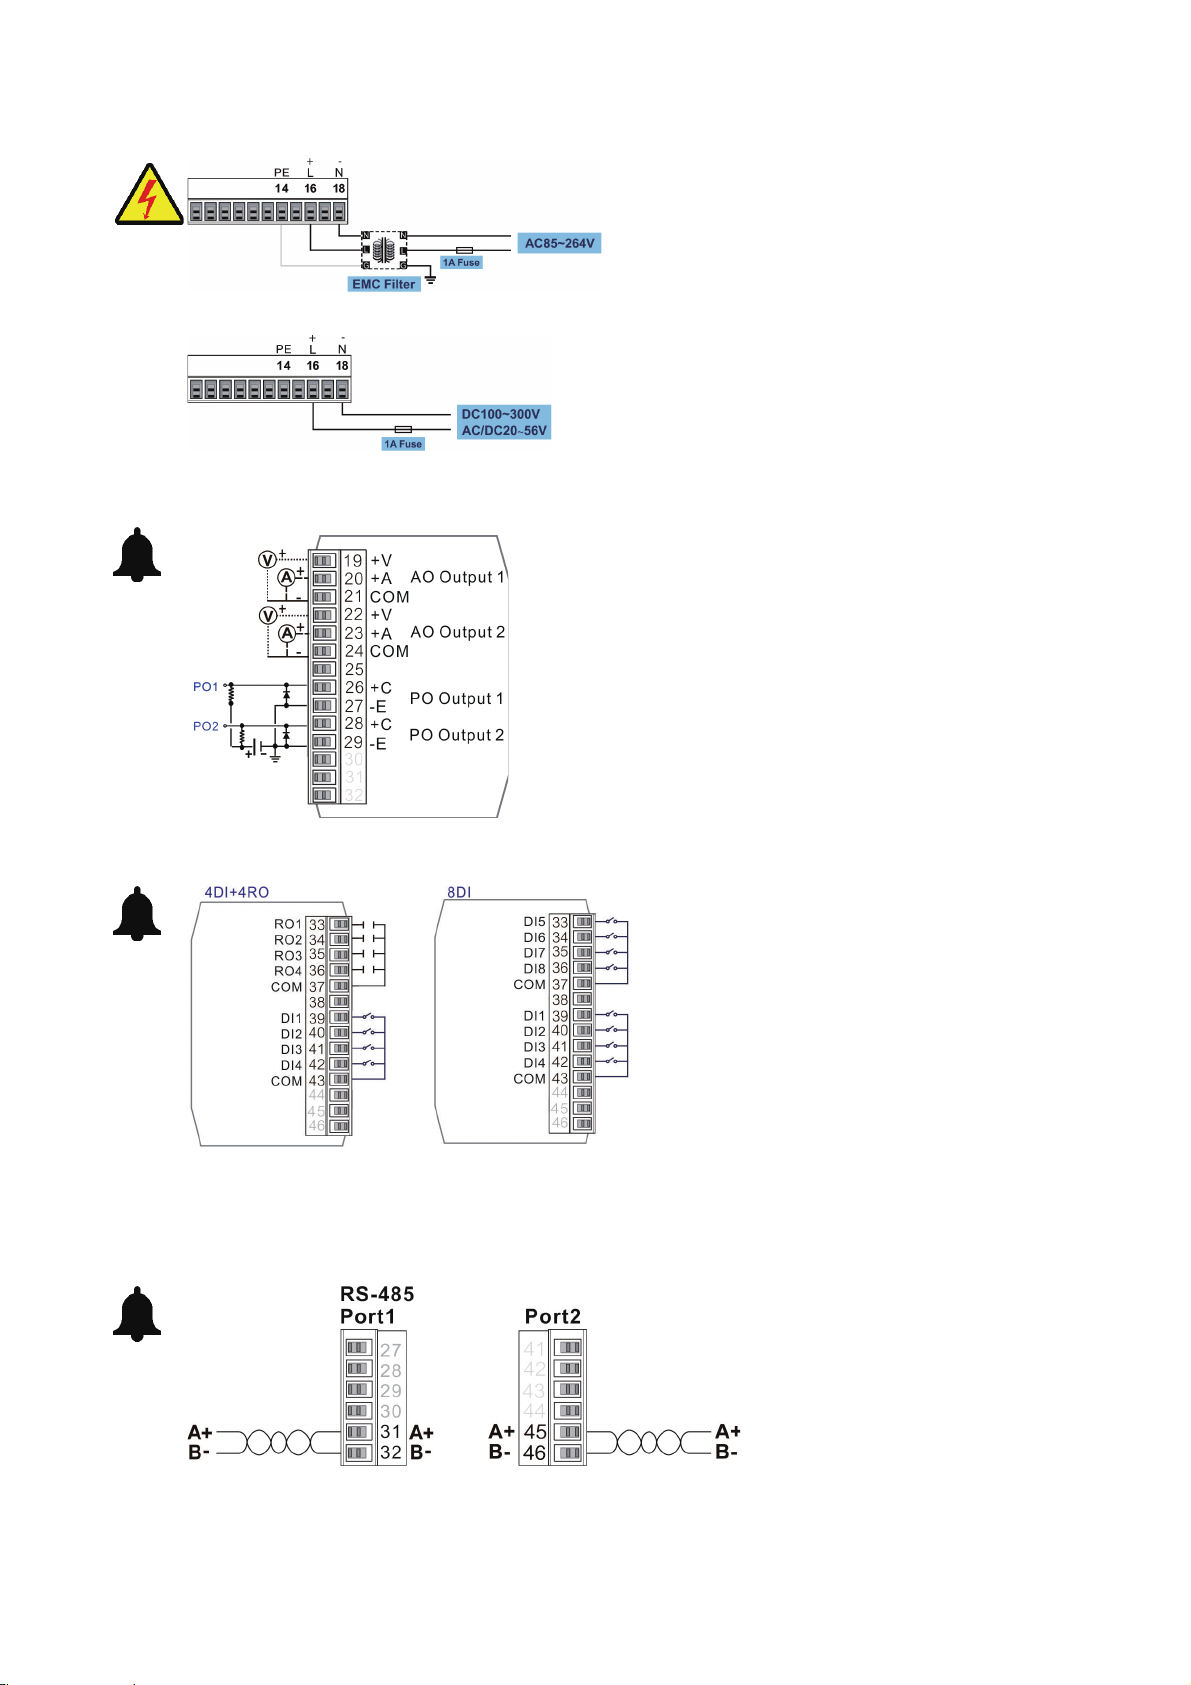
Relay output (RO) / Digital input (DI)
RS-485 communication port
AUX. Power connection
Analog output(AO) / Pulse output (PO)
AUX. Power input range:
ADH: AC 85~264V / DC 100~300V
ADL: DC/AC 20~56V
Voltage output: 0~5V / 1~5V / 0~10V , ≥1000Ω
Current output: 0~20mA / 4~20mA / 0~10mA
≤530Ω
Pulse output: Open Collector(O.C.)
30Vdc / 30mA(max)
Relay contact form: 5A/250Vac; 5A/30Vdc
DI input form: 12V/5mA
Distance: 1200M max
Terminate resistor (at last device): 120~300Ω/0.25W (typical: 150Ω)

9
①
②
③
④
⑤
Chapter 3 Meter display and operation
This chapter describes how to use the operation buttons to access the required power
measurement information and how to set the relevant parameters correctly.
3.1 Meter panel
1. Screen title
2. Main display area
3. Notification area
4. Buttons symbols
5. Operation buttons
3.2 Display screen and operation buttons description
AFM-8A series display panel is a 3.5 inch TFT-LCD, the resolution is 320 * 240 pixels.The
display content and the way will be flexible according to the actual needs. There are four
physical buttons at the bottom of the panel.
10
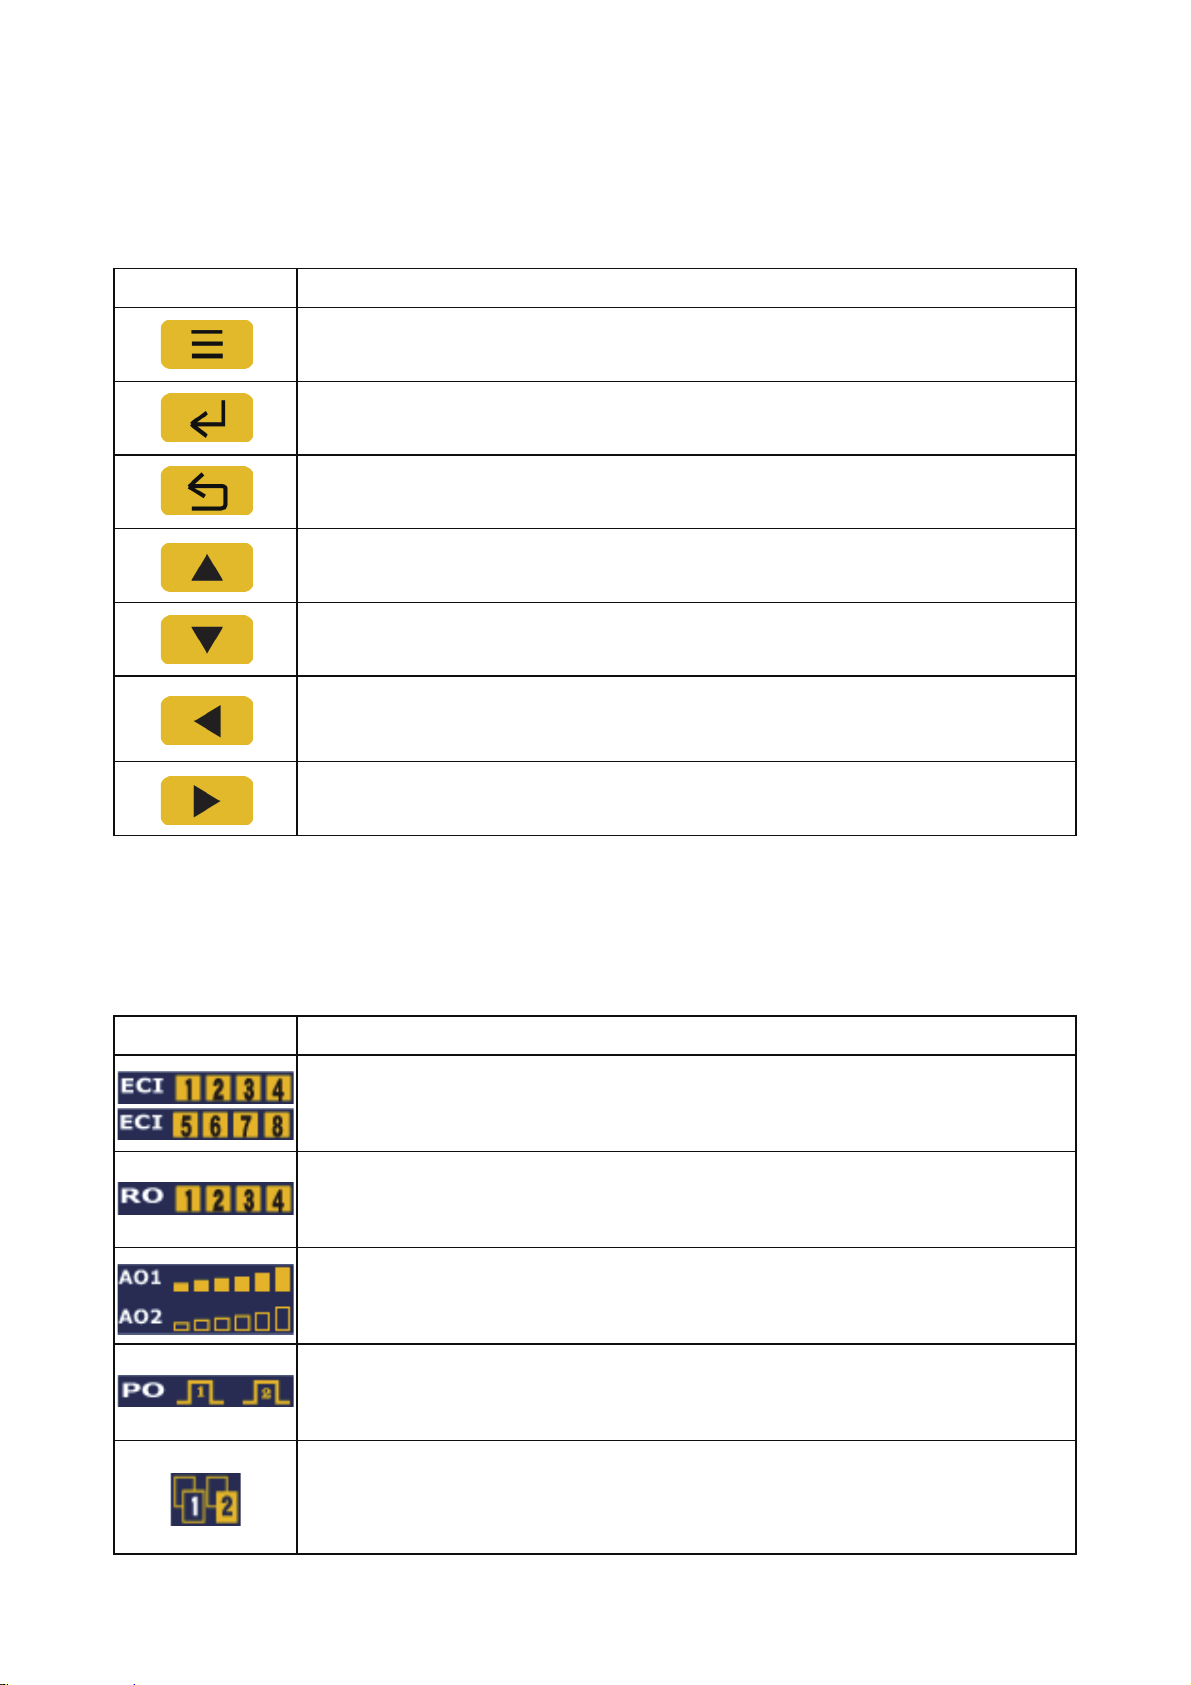
3.2.1 Operation buttons
The buttons function below the screen will vary depending on the content of the
screen,and function icon for the button is displayed at the bottom of the screen. The
functions described are as follows:
Icon Description
Menu key
Into quickly index list page
Enter / Confirm key
Go to the next menu page or confirm the input parameters
ESC key
Return to the previous page
Up key
Move the cursor or increase the number
Down key
Move the cursor or decrease the number
Left key
Move the number input position or press and hold 2 seconds to return to
the previous page
Right key
Go to next page
3.2.2 Symbol icons in main screen
On the left side of the main screen is the I/O status and the system indication icon,
describe as below:
Icon Description
Digital input 1~8 status indication, the number is displayed when there is
an input trigger.
Relay output 1~4 status indication, the number is displayed when there
is a relay output.
Analog output status indication, each cell represents a 20% output
percentage.
Pulse output 1~2 status indication, the number is displayed when there
is a pulse output.
Communication indication, when the block to blink that mean is data
being transmitted or received, upper block is receive, the lower block is
transmission.
1 and 2 are port 1 and port 2.

11
Icon Description
Load type indication, resistive / capacitive / inductive type.
System power 1 ~ 4 quadrant indication.
TOU execute indication, the numbers below are represented by left to
right respectively:
Season / Time table / Segment number
Data logging execute indication.
Current load indication, each cell represents a 10% load percentage.
3.3 Measurement data display and key operation
The main screen of the meter has three kinds of summary display page and two
function pags can be set, also can get these pages scrolling. Press in any of the
summary display pages, will see the screen appears yellow cursor, press the up and down
keys to move the yellow cursor to the measurement parameters you want to query and
press again, then can get details of the parameters.
p
p
p
p
p
p
y
p
p
p

12
The measurement parameters are displayed as follows:
Phase voltage Line voltage
Active power
Power factor
Power demand
Power demand
Power demand
Reactive power
Apparent power
Active energy
Summary power
Neutral current
Voltage harmonic
Reactive energy
Current harmonic
Voltage and current individual harmonics
Voltage and current individual harmonics
Current demand
Unbalance
UnbalanceCurrent
→
→
→
→
→
→
→
→→
↑
↓
↓
↑
↓
↑
↓
↑
↓
↑
↓
↑
↓
↑
↓
↑
↓
→
→→
Also in any one of the summary display page
press into quickly index list page. Press the up
and down keys to select the item to be queried then
press

13
Quickly index list:
Voltage Voltage L-N
Voltage L-L
Unbalance
Current Current
Unbalance
Demand Current
Power Active Power
Reactive Power
Apparent Power
Demand Power
Harmonic THD Voltage
THD Current
Individual
Energy Energy Summary
Active Energy
Reactive Energy
Power Factor Power Factor

14
MAX/MIN Phase Voltage
Line Voltage
Active Power
Apparent Power
Frequency
THD Voltage
Current
Reactive Power
Power Factor
Unbalance
THD Current
Demand Current
Demand Power
Demand Demand Current
Demand Power
TOU Data Last Month
This Month
Yesterday
Today
Phasor Diagram
Waveforms
Phasor Diagram
Waveforms
Event Log
Real Time Wave
Event Log
Real Time Wave
Information System
I / O Status
CO2
Version
Wiring
Meter

15
3.4 Max/Min data display and key operation
Enter the max/min query page after the parameter list appears on right of screen, press
the up and down keys to select the item to be queried then press
Press right key to switch the maximum / minimum screen.
Press the up and down keys to switch between different parameters.
Press return to the previous list page.
g
g
3.5 Demand data display and key operation
To query the demand data can enter from the summary display page or from the quickly
index list into the query.
Demand of current or power is shown on one page. The notification area below shows
the calculation of the demand and the calculated interval time.

16
ŗ
IJ
ŗ
ij
ŗ
Ĵ
Ŋ
IJ
Ŋ
ij
Ŋ
Ĵ
ĴĶ ĵı ĵĶ Ķı ĶĶ ķı
Individual Harmonic
Power System: 3P4W-3CT
35th 18.2%
14:04:00
3.6 Harmonic data display and key operation
To query the harmonic data can enter from the summary display page or from the quickly
index list into the query.
THD of voltage or current is shown on one page. 2nd~63rd individual harmonic divided
into two page displays.
In the individual harmonic query page, press the left and right keys to move the cursor,
then the top of the page will display the which harmonics and the value. Press down key to
switch the voltage and current of each phase of the harmonic screen.
Table of contents
Other ADTEK Measuring Instrument manuals


