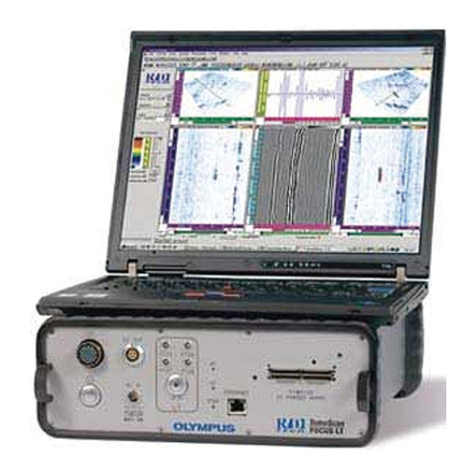
Delta OHM HD30.1 User manual

Operating manual
Spectroradiometer
– Data Logger
HD30.1
www.deltaohm.com
English
Keep for future reference.
Companies / Brands of GHM

HD30.1 -2-V1.3
INDEX
1INTRODUCTION.................................................................................................... 3
2INSTRUMENT COMMISSIONING............................................................................ 5
3MEASUREMENT GUIDE.......................................................................................... 8
4HANDLING AND STORING MEASUREMENTS........................................................ 32
5SOFTWARE UPDATE............................................................................................ 41
6 INSTRUMENT SETUP........................................................................................... 43
7 EXPORTING MEASUREMENTS.............................................................................. 49
8 STORAGE ........................................................................................................... 52
9 PROBE CALIBRATION ......................................................................................... 53
10 TECHNICAL FEATURES........................................................................................ 54
11 ORDERING CODES .............................................................................................. 57

HD30.1 -3-V1.3
1INTRODUCTION
Fig.1.1 Data logger-indicator HD30.1 Fig.1.2 Measuring probe HD30.S1
The data logger-indicator, running Linux operating system, handles data processing and
management. It has a large color touchscreen display, ensuring easy execution, display and
logging of measurements.
Spectra and derived quantities can be saved both into internal (150MB) and external
memory (micro SD-card1or USB device).
The export format is compatible with the most common programs for data analysis and pro-
cessing. In addition to data storage, the software allows saving graph images.
The main quantities of photo-radiometric interest are directly calculated by the HD30.1
through the supplied software.
The analyzed spectral range varies according to the used measuring probe:
Visible Spectral Region (380nm-780nm) with the HD30.S1 probe,
Ultraviolet Spectral Region (220nm-400nm) with the HD30.S2 probe.
Measuring probes are interchangeable and calibrated (the calibration file is stored inside
each probe).
The probe HD30.S1 analyzes the visible spectral region (380nm-780nm) and calculates the
following photo-colorimetric quantities:
1Delta OHM guarantees only for operation on products supplied by Delta OHM.

HD30.1 -4-V1.3
Illuminance [lux], Correlated Color Temperature CCT [K], Trichromatic Coordinates
[x,y] (CIE 1931) or [u’,v’](CIE1978), CRI (color rendering index, R1…R14, Ra) , PAR
[µmolphot/sm2] (fig. 1.3)
Figure 1.3
The probe HD30.S2 analyzes the ultraviolet spectral region (220nm-400nm) and calculates
the following radiometric quantities:
UVA Irradiance (W/m2), UVB Irradiance (W/m2) and UVC Irradiance (W/m2) (figure 1.4).
Figure 1.4
Both sensors have a view of the input equipped with a new generation diffuser which allows
optimizing the response according to the cosine law and not introducing any spectral defor-
mation. Data concerning the calibration of the probe are stored in non-volatile memory and
are read by the indicator.

HD30.1 -5-V1.3
2INSTRUMENT COMMISSIONING
The instrument is delivered with disconnected battery pack inside the battery compartment
(figure 2.1).
Figure 2.1: Disconnected battery inside battery compartment.
To connect the battery pack, proceed as follows:
1- Remove the cover of the battery compartment (Figure 2.1)
2- Remove the battery pack from the housing (Figure 2.2)
Figure 2.2: Battery removed from housing.

HD30.1 -6-V1.3
3- Plug the battery pack connector to the HD30.1 device (figure 2.3).
Figure 2.3: Battery connector on HD30.1 device
4- Insert the batteries into the battery compartment (figure 2.4).
5- Close the cover.
Connector for
battery
to HD 30.1 device

HD30.1 -7-V1.3
6- Switch the device on with the on/off switch (figure 2.5).
8-pole M12 male connector
for connecting probe
to instrument
on/off switch
Figure 2.5: On/Off switch.8-pole M12 male connector for connecting probe to instrument
The instrument works both with the battery and the external power supply (if power supply
is used, the battery must be installed into the instrument).

HD30.1 -8-V1.3
3MEASUREMENT GUIDE
1. When switching the instrument on, a yellow led (steady at first and then blinking) shows
that the instrument is starting. After 20 seconds, the instrument is operating and the start-
up screen appears if no probe is connected (fig 3.1)
Figure 3.1: Start-up screen with no probe connected.
all measurement functions in the screen are disabled.
appears in the header (blue bar on the top of the screen).
If a probe is already connected to the HD30.1 or is connected after the start-up, the splash
screen shows the enabled measurement options available for the connected probe:
Spectrum, photo-colour, radiometry and transmission for the HD30.S1 probe (figure 3.2),
Figure 3.2: Start-up screen with HD30.S1 probe connected.
Spectrum, radiometry and transmission for the HD30.S2 probe (figure 3.3)
Figure 3.3: Start-up screen with the HD30.S2 probe connected.
Connected will appear in the top bar to show that a probe is connected.

HD30.1 -9-V1.3
2. Connect the device for the data storage (otherwise data will be saved in the internal
memory of the instrument; the device where data are stored is shown in the blue bar on the
top), for more details see chapter “Handling and storing measurements”.
3. Select the type of analysis to be performed among the available ones:
3.1 SPECTRUM (HD30.S1 and HD30.S2 probes),
In this mode, the emission spectrum of the sources can be displayed or ambient light can
be measured in a simple and immediate manner with no further operations. The start-up
screen for this measurement will be displayed as shown on figure 3.4.
Fig.3.4: Measured spectrum in Spectrum operating mode
3.1.1. Select the operating mode of the instrument among the available four modes (SIN-
GLE, CONTINUE, MONITOR, LOGGING). By pressing the button two arrow sliders
are displayed; by pressing the button the operating mode changes as shown on fig-
ure 3.5.
Select integration
time
Start measuring
Operating
mode

HD30.1 -10 -V1.3
Figure 3.5: Select the operating mode using the arrow keys. Selection keys
disappear by pressing any other key.
3.1.1.1 SINGLE
Single measurement. The measurement is started by pressing . Once the measure-
ment is completed, the results are saved in a file with the file name automatically assigned
(the name of the saved file is like: spv-yymmddHHMMSS.txt for measurements performed
by the probe HD30.S1 and spu-yymmddHHMMSS.txt for measurements performed by the
probe HD30.S2).

HD30.1 -11 -V1.3
3.1.1.2 CONTINUE
Measurements performed are continuous. Measurements are started by pressing the
button, once the measurement is completed; the instrument starts a new measurement.
Measurements are stopped by pressing the button. All measurements are stored in a
directory named spv-yymmddHHMMSS.txt for measurements performed with the HD30.S1
probe and spu-yymmddHHMMSS.txt for measurements performed with the HD30.S2 probe.
3.1.1.3 MONITOR
Measurements performed are continuous and are started by pressing , once the
measurement is completed, the instrument starts a new measurement. Measurements are
stopped by pressing .
Note: Measurements are not saved.
3.1.1.4 LOGGING
The instrument performs a measurement on expiry of a set time interval. The logging inter-
val can be selected among the following time intervals:
3, 5, 10, 15, 30, 60 min.
Logging is enabled by pressing and stopped with . All measurements are saved
in a single directory automatically created under the name of LOG-yymmddHHMMSS (log-
ging start date and time), files saved in the directory will be named spv-
yymmddHHMMSS.txt for measurements performed with the HD30.S1 and spu-
yymmddHHMMSS.txt for measurements performed with the HD30.S2. While measuring, the
page header blinks red and shows the remaining time before next log.
.
3.1.2 Integration time calculation. Integration time selection is automatic by default.
Pressing the button the two arrows for the manual setting of the integration time are
displayed:

HD30.1 -12 -V1.3
3.1.2.1 Manual Selection: the integration time is manually selected with arrow keys. The
available integration times are: 1, 2, 4, 8, 16, 32, 64, 128, 256, 512, 1024, 2048, 4096 ms.
At the top of the graph, the instrument will show if the performed measurement is underex-
posed or overexposed (figure 3.6)
Figure 3.6: correct exposure time is displayed on top of graph.
In Monitor, Continuous and Logging operating modes, measurements will be all performed
with the same integration time set before starting measurements.
3.1.2.2 Automatic Selection (default)
In mode, at the start of the measurement, the instrument searches for the best
integration time. The search may take up to 30 seconds. Once the search process is com-
pleted, the instrument carries out the measurement by using the optimal integration time.
If the instrument is in , and operating modes, it will start
searching for the optimal integration. Measurements are started after determining the inte-
gration time. At each measurement, if the previous measurement is underexposed, the new
integration time will be increased; if it is overexposed, the integration time will be reduced,
if the measurement is optimal, the new integration time will not be changed.
3.1.3 Averaged Measurements
Set the desired number of samples to be averaged by means of the key and of the
arrow keys that appear when the key is pressed (the maximum number of averaged sam-
ples is set to 20).
OK
OVEREX-
POSED
UNDEREXPOSED

HD30.1 -13 -V1.3
3.1.4 Press the key to perform the measurement.
Once the measurement is completed, the spectrum will be displayed; wavelengths will be
shown in the X-axis as nanometers (220 nm-400 nm for the HD30.S2 probe, 380 nm-780
nm for the HD30.S1 probe) and the measured spectral irradiances in the Y-axis: the last
spectrum is displayed in continuous and logging operating modes (figure 3.7).
Figure 3.7: Spectrum display at the end of measurement
The name of the saved file and the integration time used for measuring are shown on top
right of the screen (fig. 3.8)
SPV_140921154215
T=256ms
Figure 3.8: Data concerning file and integration time are shown on top right of the screen.
Scroll
cursors
Enter
comment
Export

HD30.1 -14 -V1.3
Exit the screen by pressing the key (bottom right) to display the other measure-
ments concerning the same acquisition (continuous or logging mode), the program will re-
turn to the main screen.
Press the key, select the directory of the measurements of interest, upload the file by
using the arrow keys on the right of the screen, scroll the files of interest concerning the
performed acquisition (for more details see the chapter Handling and storing measure-
ments).
The measured spectrum is displayed with two cursors ( , ). The cursor posi-
tion is shown on the top bar together with the measured irradiance value.
Initially, the cursor is positioned on the maximum spectral irradiance value, while
is positioned at the extremity of the wavelength available on the probe.
You can select which cursor should be moved using the key, select if you
want to move the two cursors at the same time. Cursors are moved by using the arrow keys
(to move the cursor to the left), (to move the cursor to the right).
By pressing the key the box (fig. 3.9) for adding a comment to the measurement
shown on the screen will be display.
Fig. 3.9 : Comment Box
Press to return to the main menu Fig.3.1.

HD30.1 -15 -V1.3
3.2 PHOTO-COLOR (HD30.S1 Probe)
This operating mode is active only with the probe HD30.S1. Besides the emission spectrum,
the main photo-colorimetric quantities can be displayed, such as:
illuminance (Lux), trichromatric coordinates CIE 1931 (x, y) and CIE 1976 (u’,v’), the Cor-
related Color Temperature CCT (K) and the Color Rendering Index CRI (the general index
and the index of each of the 14 reference samples). By pressing the Photo-color button you
access the screen in figure 3.10
Figure 3.10: Photo_color measuring mode startup screen
3.2.1 Select the operating mode of the instrument among the four available modes (SIN-
GLE, CONTINUE, MONITOR, LOGGING). By pressing the two scroll arrow cursors
are displayed, pressing makes the operating mode change as shown on figure 3.11.
Select integration
time
Start measuring
Operating
mode

HD30.1 -16 -V1.3
Figure 3.11: Select the operating mode using the arrow keys. Selection arrow keys disap-
pear when pressing any other key.
3.2.1.1 SINGLE
Single measurement. Measurement is started by pressing the key. Once the meas-
urement is completed, the results are saved in a file with an automatically assigned name
(the name of the saved file is like: spv-yymmddHHMMSS.txt.

HD30.1 -17 -V1.3
3.2.1.2 CONTINUE
Measurements are performed in continuous. Measurements are started by pressing the
button ; once the measurement is completed, the instrument starts a new measure-
ment. Measurements are stopped by pressing button. All measurements are stored
in a work directory named spv-yymmddHHMMSS.txt.
3.2.1.3 MONITOR
Measurements are performed continuously and are started by pressing , once the
measurement is completed, the instrument starts a new measurement. Measurements are
stopped by pressing .
Note: Measurements are not saved.
3.2.1.4 LOGGING
The instrument carries out a measurement on the expiry of a set interval. The logging inter-
val can be selected among the following time intervals:
3 , 5 , 10 , 15 , 30 , 60 min.
Logging is started by pressing and stopped by pressing . All measurements
are saved in a single, automatically created directory named LOG-yymmddHHMMSS (log-
ging start date and time), files saved in the directory will be named spv-
yymmddHHMMSS.txt. While measuring, the page header blinks red and shows the remain-
ing time before next log.
.
3.1.2 Integration time calculation selection. Integration time selection is automatic by
default. Pressing the button displays the two arrows for the manual setting of the
integration time:

HD30.1 -18 -V1.3
3.2.2.1 Manual Selection: the integration time is selected manually by using the arrow
keys . The available integration times are: 1, 2, 4, 8, 16, 32, 64, 128, 256, 512, 1024,
2048, 4096 ms.
On top of the graph the instrument will show if the measurement just performed is under-
exposed or overexposed (figure 3.12).
Figure 3.12: The correct exposure is displayed on top of the graph.
In Monitor, Continuous and Logging operating modes, measurements will be all carried out
with the same integration time set before starting measuring.
3.2.2.2 Automatic Selection (default)
In mode, at measurement start-up the instrument searches for the optimal inte-
gration time. The search may take up to 30 seconds. Once the search process is completed,
the instrument carries out the measurement with the optimal integration time.
With , or operating modes, at measurement start-up the in-
strument searches for the optimal integration time. Measurements are started after deter-
mination of the integration time. At each measurement, if the previous measurement is un-
derexposed or overexposed, the new integration time will be changed; if the measurement
is optimal, the new integration time will not be changed.
3.2.3 Averaged measurements
Set the number of the desired samples to be averaged by pressing the button
and the arrow keys that appear (the maximum number of averaged samples is set to 20).
OK
OVEREXPOSED
UNDEREXPOSED

HD30.1 -19 -V1.3
3.2.4 Press the key to perform the measurement.
Once the measurement is completed, the spectrum will be displayed, wavelengths will be
shown in the X axis as nanometers and the measured spectral irradiances in the Y-axis: the
last spectrum is displayed in continuous and logging operating modes (fig. 3.13)
Outline
CRI
Color space
x,y CIE1976
Spectrum
Cursors handling
Fig. 3.13: Example of screen in Photo-color measuring mode after measurement completion.
The acquired spectrum is displayed on the top left of the screen; x, y coordinates are shown
on bottom left, inside the colour space CIE 1932 (x,y); the general colour-rendering index
Ra and the 14 indexes for each sample are shown on the right bottom. The main photomet-
ric info is summarized on top right:
Illuminance
Coordinates (x,y) CIE 1931
Coordinates (u’,v’) CIE 1976
Correlated Color Temperature K
CRI Ra
The name of the saved file and the integration time used for measuring are shown on top
right of the screen (figure 3.14).

HD30.1 -20 -V1.3
SPV_ 0
T=256ms
140921154215
Fig. 3.14: file name and integration time data are shown on top right of the screen
Press (bottom right) to display the other measurements related to the same
acquisition (continuous or logging mode), the program will return to the main screen. Press
and select the directory related to the measurements of interest, upload the file
and scroll the files of the same log or continuous measurement by using the arrow keys on
the right of the screen (for more details see chapter Handling and storing
measurements).
The measured spectrum is displayed together with the two cursors ( , ). The
position of the wavelength the two cursors are pointing to is shown on the top bar along
with the value of the measured spectral irradiance and of the cursors’ wavelength.
At first, cursor is positioned on the maximum spectral irradiance value, while
is positioned at the extremity of the wavelength available on the probe.
You can select which cursor should be moved using the button; select if you
want to move the two cursors at the same time. Cursors are moved using the arrow keys
and (to the left or to the right).
Press to return to the main menu Fig.3.1.
Press (bottom bar) to display one graph at a time following the sequence below
Figure 3.15.
Table of contents
Other Delta OHM Data Logger manuals

Delta OHM
Delta OHM HD50CR-AS User manual
Delta OHM
Delta OHM HD32MT.1 User manual
Delta OHM
Delta OHM HD35 Series User manual
Delta OHM
Delta OHM HD32.7 User manual

Delta OHM
Delta OHM HD50R-MB User manual
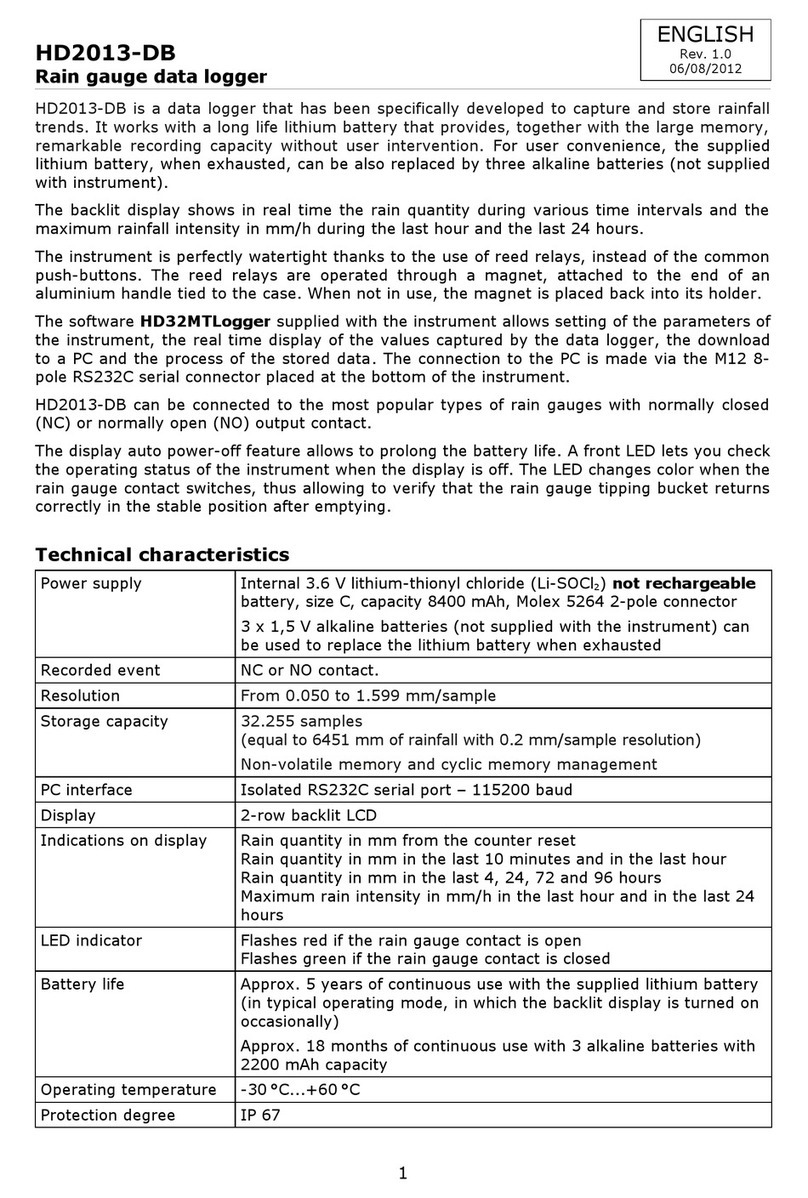
Delta OHM
Delta OHM HD2013-DB User manual
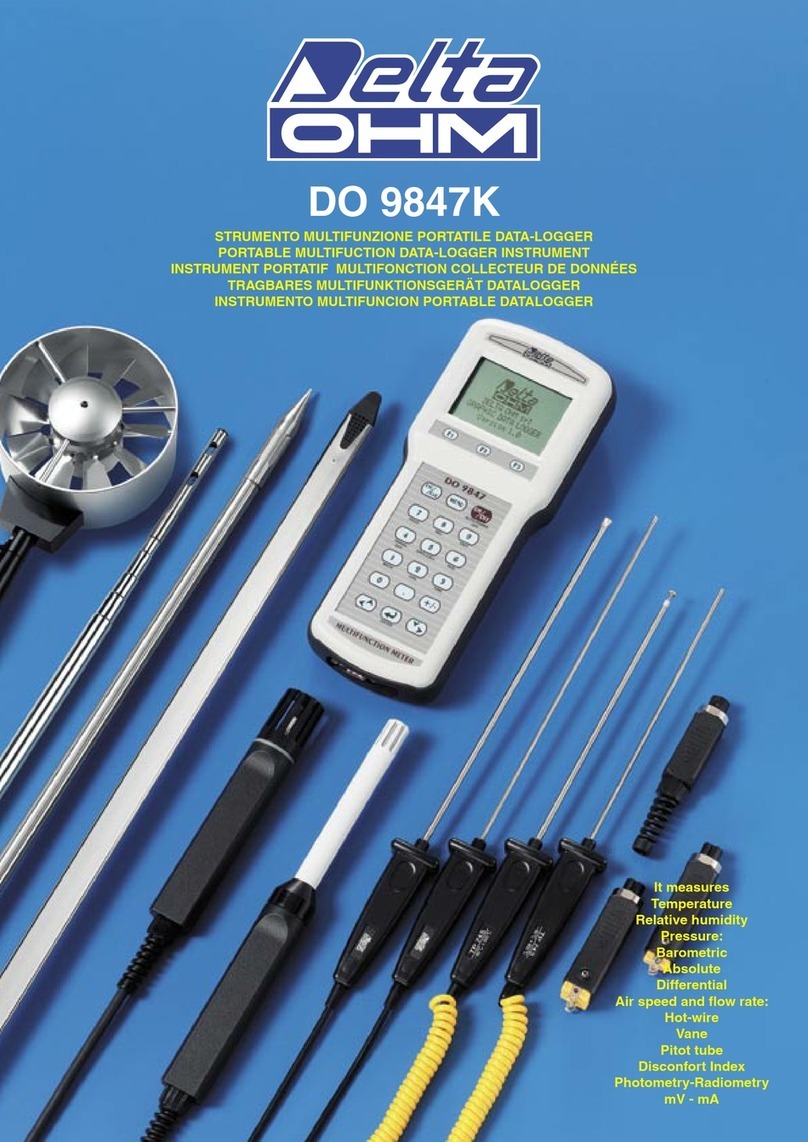
Delta OHM
Delta OHM DO 9847K User manual
Delta OHM
Delta OHM HD32.8.8 User manual
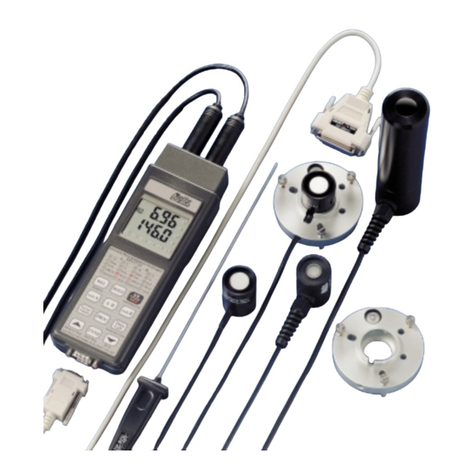
Delta OHM
Delta OHM DO 9721 User manual
Delta OHM
Delta OHM HD32MT.3 User manual
