Table
of
contents
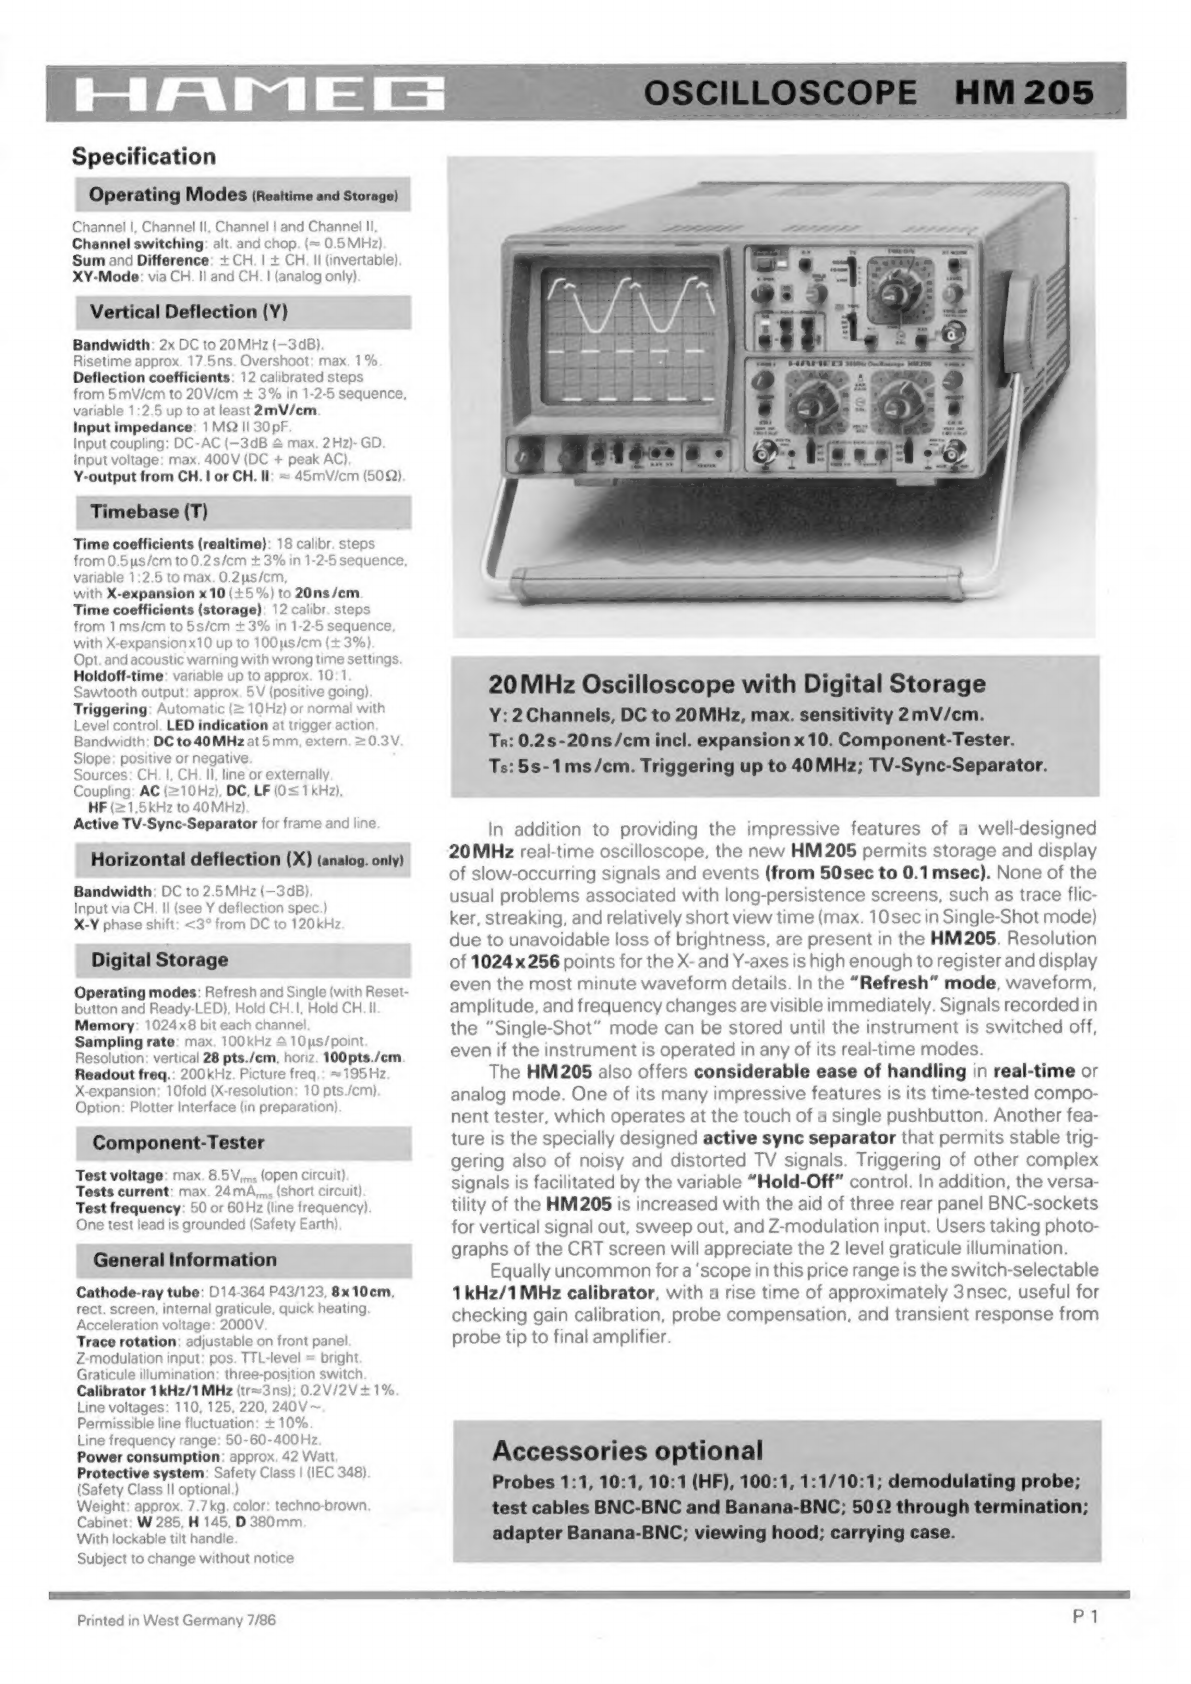
Oscilloscope
datasheet
with
technical
details
.......-.~.2.~.2...
P
1
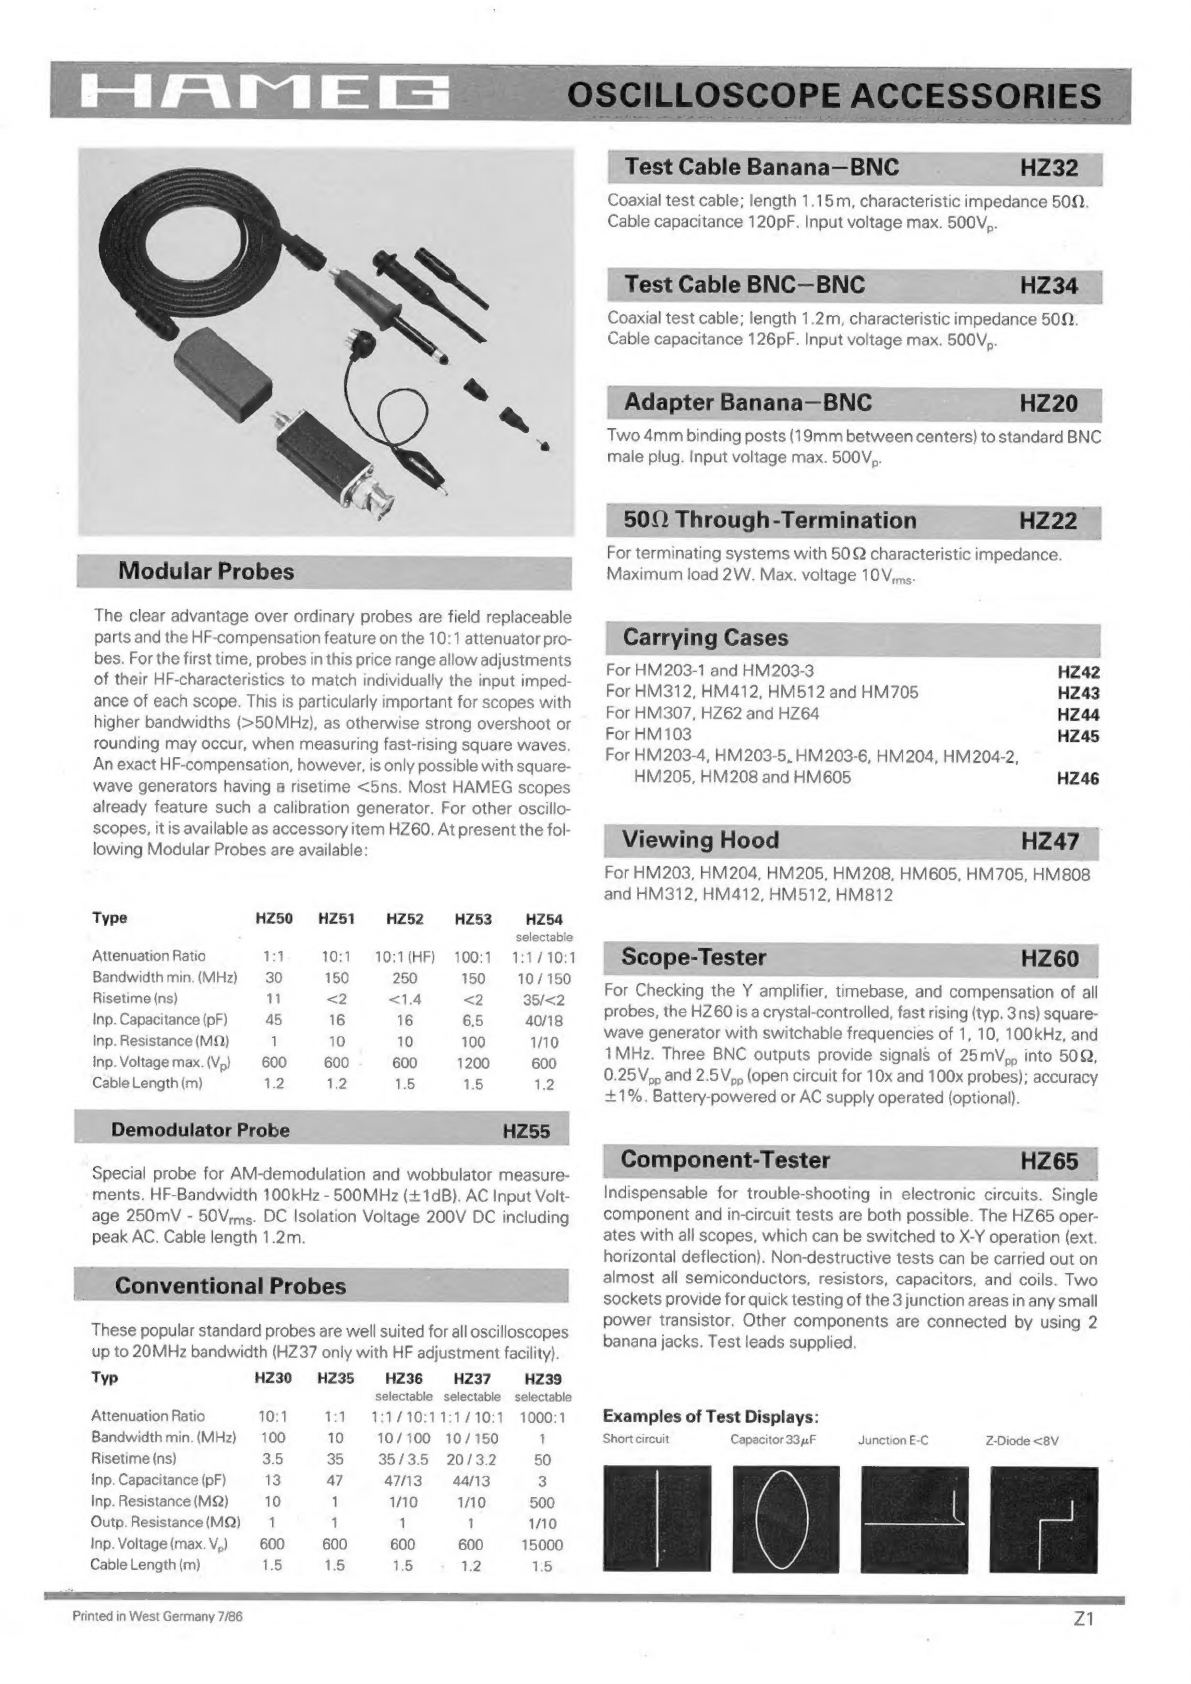
Accessories
..................-..
Z
1
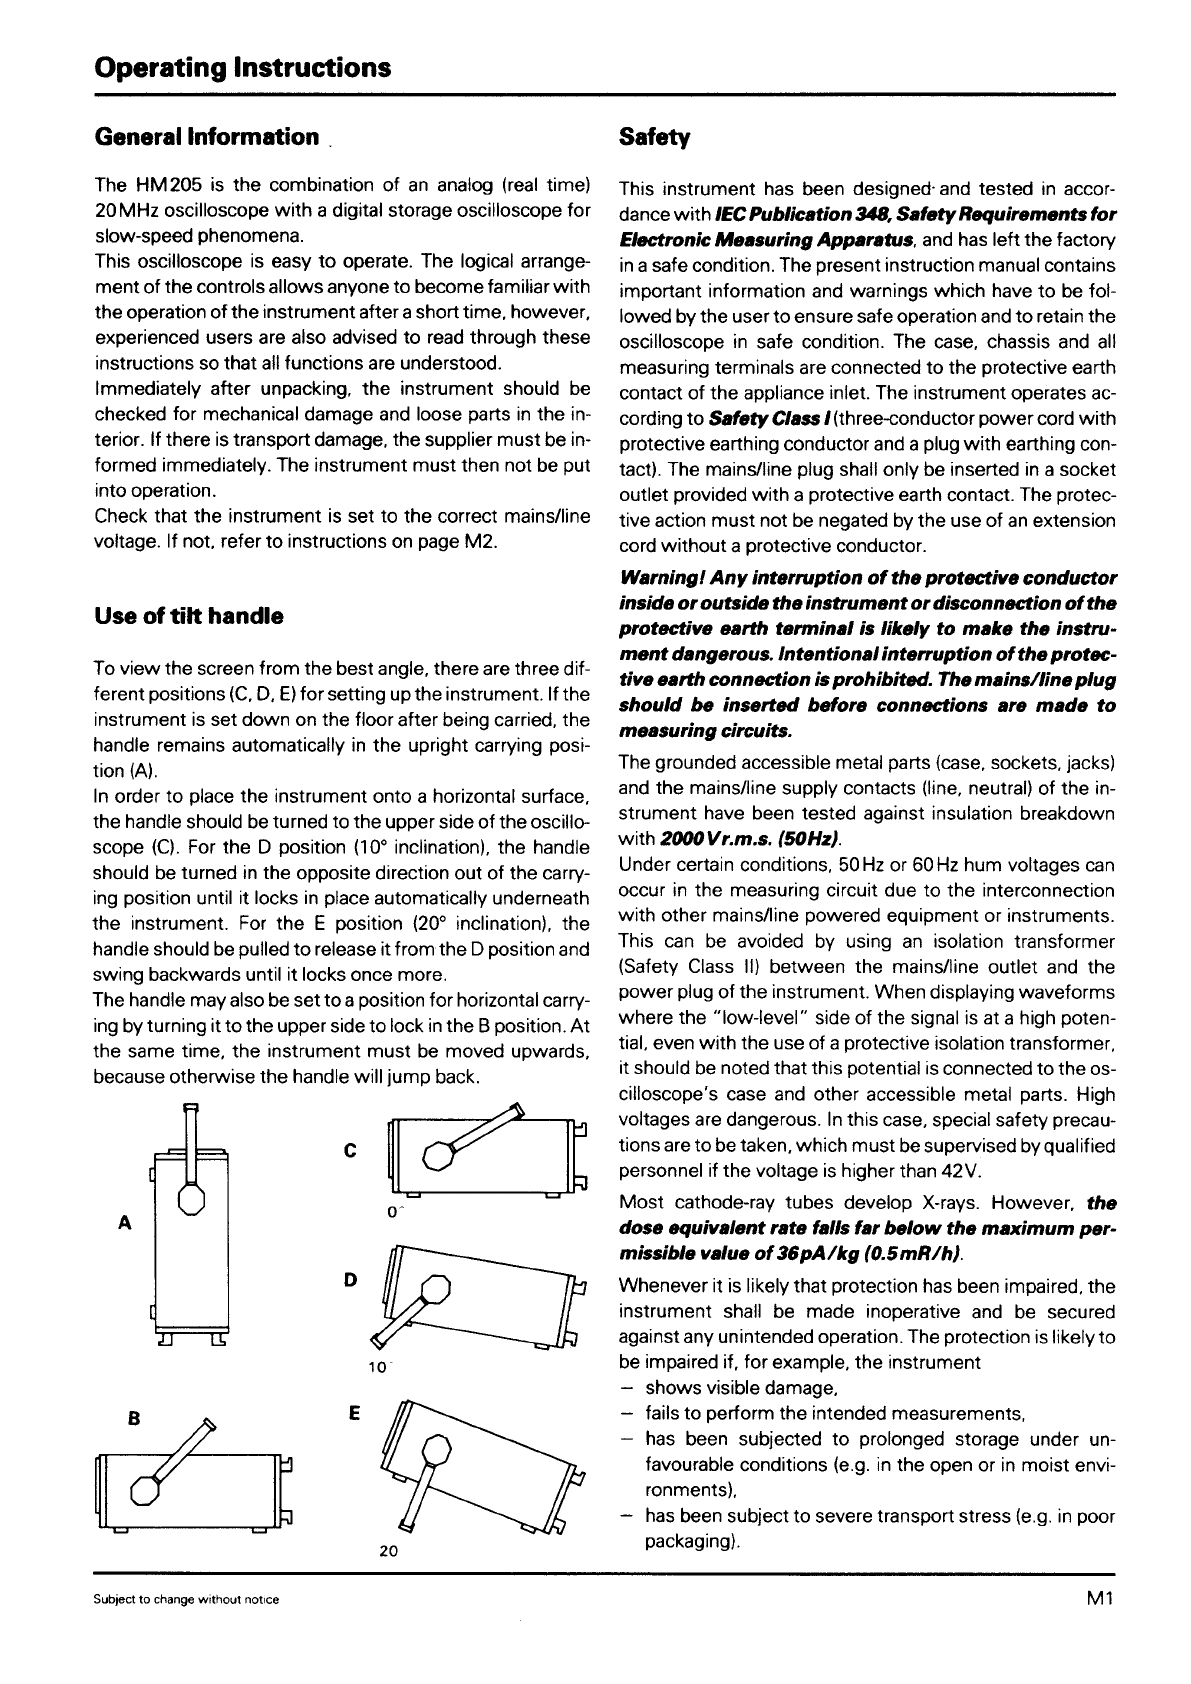
Operating
Instructions
General
Information
..........0.....
M
1
Use
oftilthande
.............0.2...
M1
Safety...
0...
ee
ee
M
1
Operating
conditions
............2.2..
M
2
Guarantee
..............0..--4.
M
2
Maintenance
............-.....-..
M
2
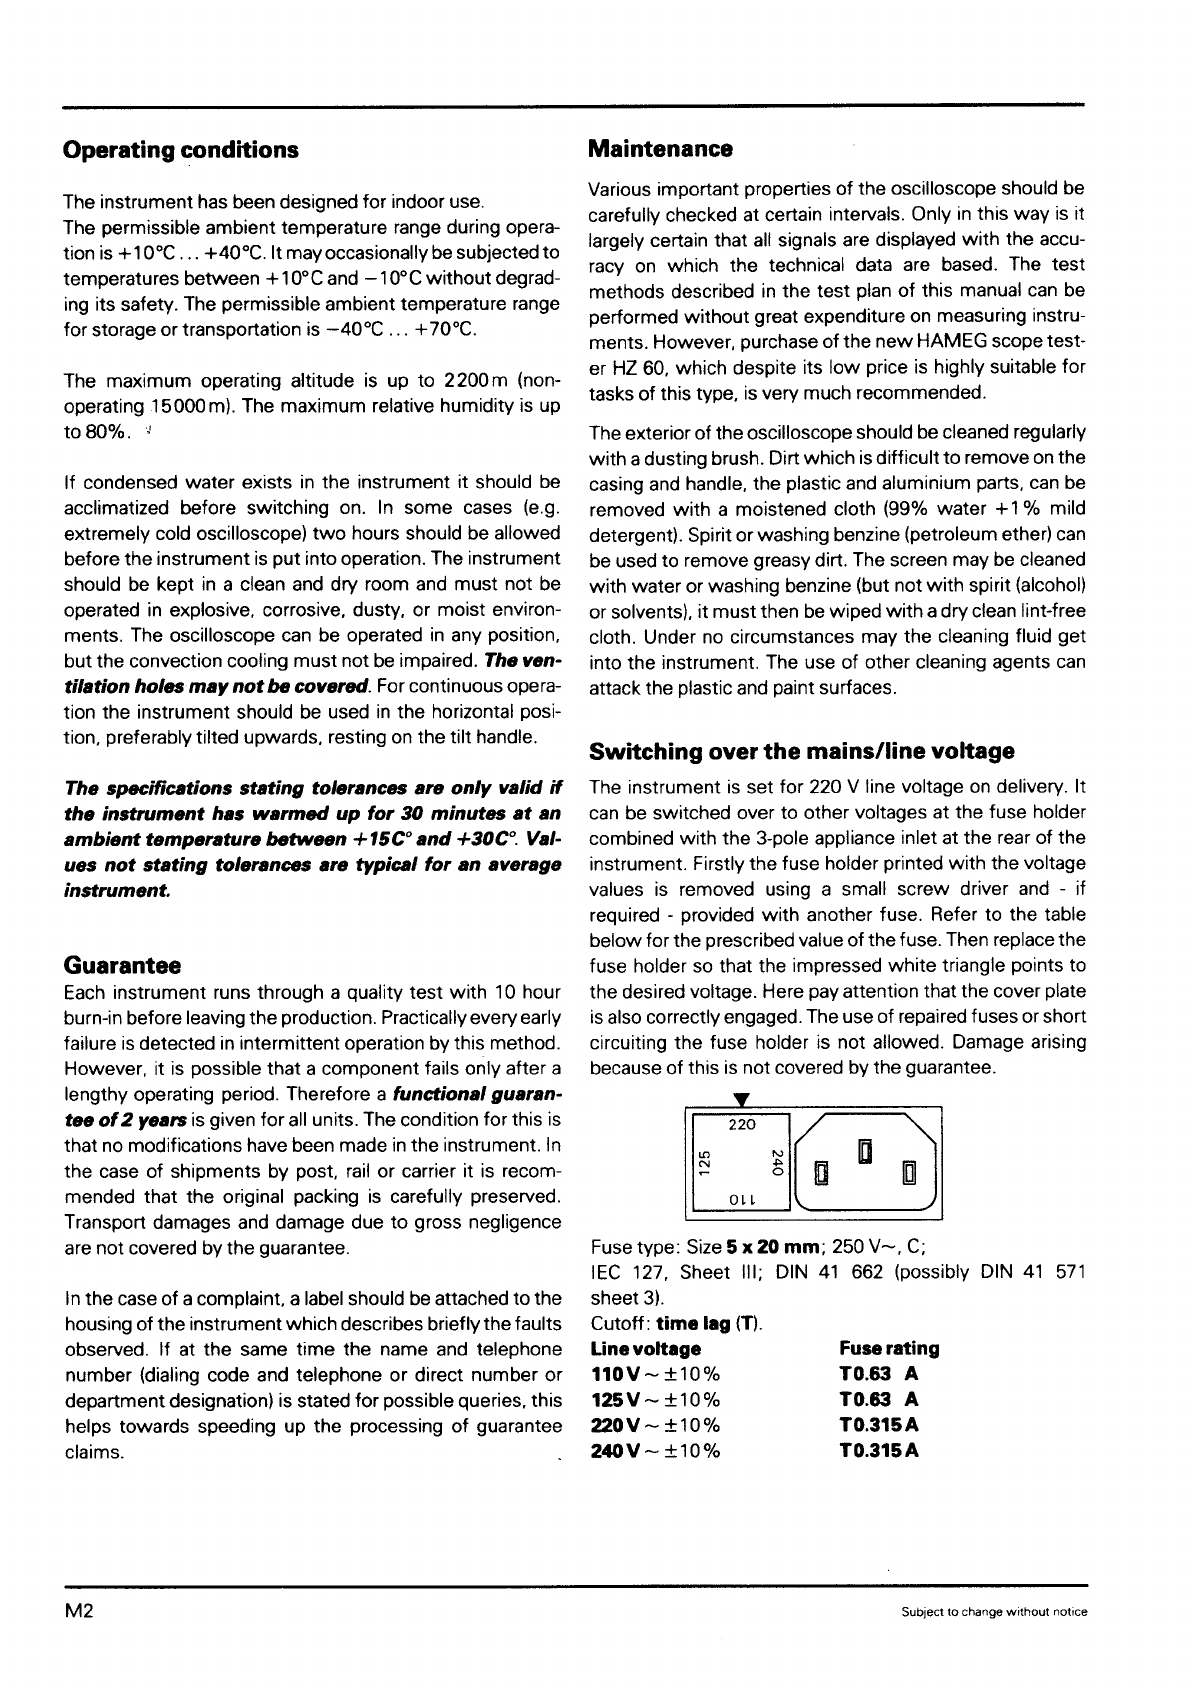
Switching
over
the
mains/line
voltage
......
M
2
.
Type
of
the
signal
voltage
..........2..
M
3
Osci
I
loscope
Amplitude
Measurement.............
M
3
HM
205
Reference
Line.
................-.
M
4
Time
Measurements
...............
M
4
Connection
of
Test
Signal
.........~.~..
M
6
First
Time
Operation
...............
M
7
Trace
Rotation
.............-.-4.
M8
Short
instruction
K
1,
DC
Balance
Adjustment
.............
M8
Front
panel
elements
Probe
compensation
anduse...........
M8
Folder
with
front
view
...............
K
2
ikHzcompensation
..............
M
8
1MHzcompensation..............
M9
Test
Instructions
Operating
modes
of
the
vertical
amplifiers...
.
M10
General...
2...
2
ee
T
1
X-Y
Operation...
2...
.0..0202.2..2.-.-..
M10
Cathode-Ray
Tube:
Brightness
and
Focus,
Phase
difference
measurement
in
DUAL
mode
M11
Linearity,
Raster
Distortions
.....
T1
Measurement
of
an
amplitude
modulation...
.
M12
Astigmatism
Check.
.............-..
T
1
Triggering
andtime
base
.............
M12
Symmetry
and
Drift
of
the
Vertical
Amplifier...
.
T
1
Automatic
Triggering.
.............
M12
Calibration
of
the
Vertical
Amplifier...
2... 2...
T
1
Normal
Triggering,
Slope...
.........
M13
Transmission
Performance
(Vertical
Amplifier)
.
.
.
T
2
Triggercoupling
.............-0.4
M13
Operating
Modes:
CHI/Il,
DUAL,
ADD,
CHOP.,
Line
Triggering
............-.....
M14
INVERT
and
X-Y
Operation...
.
.
T
2
Triggering
of
video
signals,
External
Triggering.
M14
Triggering
Checks
.................
T3
Trigger
indicator
............00.0.,
M15
Timebase...
2...
0-20.00.
-2.
002000.
T
3
Holdoff-time
adjustment...
......2.2..
M15
Holdofftime
.............2..2
000.4
T
4
ComponentTester................
M15
Component
Tester
.............-..0.0.
T
4
Testpatterns
..............0..0..
M18
Trace
Alignment
..................
T4
Mains/Line
Voltage
Checks.
.........2...
T4
Storage
Operation
Front-panelcontrols
...............
M19
Service
Instructions
Storage
resolution
and
operating
modes
....
.
M19
General...
2...
.....2.2.2...2...2.-.
S$
1
Singiechanneldisplay
..............
M20
Instrument
Case
Removal
..........2...
$1
Dualdisplay............-..-2005
M21
Operating
Voltages
..........-.2..2...
$1
Sum
and
difference
display.
...........
M21
Maximum
and
Minimum
Brightness
........
$1
Reference
linedisplay
..............
M21
Astigmatism
control
..
2...
.....02.2.0-.
S$
2
Timebase
of
low
frequency
signals.
.......
M21
Trigger
Threshold...
2...
...2.0-.-22,4
$2
Trouble-Shooting
the
Instrument...
.......
S
2
Miscellaneous
Replacement
of
Components
and
Parts
......
$3
Sawtooth
output,
Z-modulation
input...
...
.
M23
Replacement
of
the
Power
Transformer
......
S$
3
Vertical
output
(Y),
Graticule
illumination...
.
.
M23
Adjustments
.........0.....-.2004
S$
3
Subject
to
change
without
notice
7.86
-
205