Tenma 72-9355 User manual

1
Digital Storage Oscilloscope
Model No. 72-9355, 72-9360 & 72-9365

2
When using electrical appliances, basic safety precautions should always
be followed to reduce the risk of re, electric shock and injury to persons or
property.
Read all instructions before using the appliance and retain for future reference.
• This meter is designed to meet IEC61010-1, 61010-2-032, and 61010-2-033 in
Pollution Degree 2, Measurement Category CAT II 600V and double Insulation.
• Check that the voltage indicated on the rating plate corresponds with that of the
local network before connecting the product to the mains power supply.
• Do not operate this product with a damaged plug or cord, after a malfunction or
after being dropped or damaged in any way.
• Check the product before use for any damage. Should you notice any damage on
the cable or casing, do not use.
• This product contains no user-serviceable parts. All repairs should only be carried
out by a qualied engineer. Improper repairs may place the user at risk of harm.
• Take caution when voltages are above 60V DC and 30V ACrms.
• The earth probe must only be used to connect to ground, never connect to a
voltage source.
• This product must be earthed using the mains power cord ground connection.
• Do not disconnect from the mains supply and it’s ground connection when any item
is connected to this product for measurement.
• Children should be supervised to ensure that they do not play with the product.
• Always disconnect from the mains when the product is not in use or before
cleaning.
• Do not use the product for any purpose other than that for which it is designed.
• Do not operate or store in an environment of high humidity or where moisture may
enter the product as this can reduce insulation and lead to electric shock.
PRODUCT OVERVIEW
Main Features
• Dual channels; vertical deection width range : 5mV/div – 50V/div.
• Automatic waveform and status conguration.
• Storage of waveforms, setups and interfaces.
• Screen copy function.
• Fine window extension; precise analysis of waveform details and overview.
• Automatic measurement of 27 waveform parameters.
• Cursor measurement function.
• Unique waveform recording, storage and replay function.
• USB interface that supports USB2.0.
• Bright colour/mono 5.7 inch LCD panel at 320 x 240 pixel aspect ratio.
• Built-in FFT.
• Multiple waveform math functions (including add, subtract, multiply and divide).
• Edge, video, pulse width, and alternate trigger functions.
• Multimeter function.
• USB drive system software upgrade.
• Multilingual menu displays.

3
WHAT’S INCLUDED
• 2 x 1.2m, 1:1/10:1 probe (conforms with EN 61010-031:2002+A1:2008)
• Power cable
• User Manual
• 2 x current-to-voltage converter module
• Multimeter pen
• DC adaptor
CONTROLS AND CONNECTIONS
OPERATING PARAMETERS
• User-friendly front panel with clear labelling to enable access to all basic functions
for easy operation.
• Powerful trigger and analysis ability make it easier to capture and analyse
waveforms.
• Clear LCD and mathematical operating functions make it easy to use to observe
and analyse signal problems in a faster and clearer way.
Model Bandwidth Sampling Rate Display
72-9355 60MHz 250MS/s Colour
72-9360 100MHz 500MS/s Colour
72-9365 200MHz 1GS/s Colour
• The oscilloscope comes with a front panel with at-a-glance functions for easy
operation.
• There are function keys and a special function jog dial on the front panel.
• The row of 5 keys at the bottom of the display panel are menu operation keys
(designated as [F1] to [F5] from left to right). With these 5 keys you can set up
different options of the current menu.
• The other keys are function keys. You can use them to enter different function
menus or access particular functions directly.
• Apart from the waveform display zone, the
display panel also features other details about
the waveform and the unit’s control setup. These
are explained by their sequence numbers in the
above gure:
1. Trigger source status display is as follows:
A. Select signals of Channel A as the trigger
signal source.
B. Select signals of Channel B as the trigger
signal source.
AB. Select signals of Channels A and B as the
alternate trigger signal source
2. Trigger coupling mode display is as follows:
~ AC trigger coupling mode, i.e. only AC quantities
larger than 10Hz of the trigger signals can
pass the coupling capacitor. The DC% will be
intercepted. This is a general trigger coupling
mode.

4
Power on the unit
• You can select from two power supply methods : internal battery power or external
DC adaptor power. Power supply voltage of the DC adaptor is grid voltage. After
connecting to power, start the self calibration process by pressing the [USER]
button then [F3]. This will ensure optimal performance.
Accessing signals
• Press UTILITY button then F1 and the screen will display DEFAULT SETUP.
• Connect the probe to the ChA input.
• Set the probe attenuation switch to 10X position.
Note You have to set the probe attenuation factor of the
oscilloscope. This factor changes the vertical range multiple to
ensure the measurement result correctly reects the amplitude of
the signal being tested.
Set the attenuation factor of the probe as follows: Select other
menu in Channel A then set probe ratio to 10X with the jog dial.
• Return
• K-return
• Normal
• Invert
OPERATION
AUTOSET WAVEFORM DISPLAY
• Adjust the variable capacitor on the probe with an insulated screwdriver until a
correct waveform is achieved.
• The oscilloscope features an autoset function which automatically adjusts the
vertical deection factor, scanning time base and trigger mode based on the input
signal until the most appropriate waveform is displayed.
• This function only operates when the signal to be measured is 50Hz or above and
the duty ratio is larger than 1%.
• Connect the probe tip and ground clamp to the output terminal of the function signal
generator. Select a square wave of 1kHz output frequency and 3Vpp amplitude.
Press [AUTO] and you will see a 1kHZ/3Vpp square wave in the display in a few
seconds, as shown in Figure 1-5. Repeat steps 2 and 3 to check Channel B.
• Input A : On
Coupling : DC
Bandwidth limit ; Full bandwidth
Bias Voltage : Others

5
DISPLAY SETTING CONTROLS
Using the Autoset function
• Connect the signal to be measured to the signal input channel.
• Press AUTO and the oscilloscope will scan the time base and trigger mode and set
the vertical deection factor. You can manually adjust further after this process to
get the optimum display.
Vertical control
• Pressing the key to adjust the vertical range (V/div) of the oscilloscope, you can
adjust the signal to a size best suited to screen.
• Pressing the key adjusts the position of the reference waveform so you can
adjust the position on the screen display.
Horizontal control
• Pressing the key to change the horizontal time base range setup. Range of
horizontal scanning rate is 5ns-50s/div (72-9360) in steps of 1-2-5.
• Pressing the key adjusts the position of the reference waveform so you can
adjust the position on the screen display. You can observe more pre-trigger
information.
The Trigger System :
• Press [TRIGGER] to adjust the trigger setup of the waveform.
mV
V
S nS

6
INSTRUMENT SETUP
Vertical system setup
Channel A, Channel B and shifting signals vertically
• Each channel has its own menu. Set up each item for each channel individually.
Press the [A] or [B] function key and the system will display the operation menu for
Channel A or Channel B.
Resetting the Instrument
• To use factory setup, follow the steps below :
• After connecting to power press [POWER] to turn the oscilloscope on. When the
power-on screen appears, press and hold the [CLEAR/MENU] key to select factory
setup. When setup is done, this screen will appear.
Using the Jog Dial Function
• The jog dial is a multifunction control that enables
easy operation and control of various menus. The
example below illustrates the use of this dial.
Making menu selection with the jog dial
• Press [SCOPE]. The menu in the gure below
appears at the bottom of the screen.
Parameter measurement
Frequency counter
Off
• Press F3 to select the display menu.
• With the jog dial, select the display type. The selected
menu will appear bold. Turn the jog dial to make a
selection, then press the jog dial once to conrm. The
screen will then enter the next menu. If you wish to
change the format repeat the above steps. Otherwise
press the jog dial to close this menu.
• Press F5 to return to a previous selection option and reset that page.
Input A On
Off
Channel A on
Channel A off
Coupling DC
AC
Ground
AC and DC quantities of input signal is allowed to pass.
This mode is for observing DC or exchange signals with DC
quantities.
DC quantities of the input signal are intercepted. This
mode is for observing exchange signals with DC quantities
intercepted.
DC level of the channel input terminal upon equivalent
grounding is displayed.
Bandwidth
Limit
Full
Bandwidth
20MHz
The oscilloscope’s frequency bandwidth is full bandwidth.
Limit bandwidth to 20MHz to reduce display noise.
Bias Voltage Voltage
Reset to zero
Return
Adjust the channel bias voltage with the jog dial. When the
DC quantities of the signal being tested are much larger
than the amplitude of the AC signal, you can offset the DC
quantities with bias voltage. In this condition, you can observe
the amplied AC signal.
Reset the bias voltage to zero.
Go back to the Channel A menu

7
Others Probe ratio 1X
10X
100X
1000X
Select one of the values based on the probe
attenuation factor to keep the reading of the
signal being measured correct.
Polarity Normal
Invert
Normal waveform display
Waveform is inverted
Setting channel coupling
• To apply a signal to Channel A. The signal being
tested is a sine signal that contains DC quantities.
• Press [A] to select Channel A. Then press [F1] to set
A input to “ON”.
• Next press [F2] to select DC coupling. Both DC and
AC quantities of the signal being tested and input to
Channel A can pass through.
• Press [F2] to select AC coupling. DC quantities of
the signal being tested and input to Channel A will be
intercepted. Only AC quantities can pass through.
• Press [F2] to select ground coupling. The channel
input is now set to equivalent ground. The channel
input level appears on screen.
Note: In this mode, although waveform is not displayed,
the input signal remains connected to the channel circuit.
Setting the channel bandwidth limit
• Applying a signal to Channel B. The signal being
tested is a signal stacked with high frequency
quantities.
• Press [B] to turn Channel B on. Next press [F3] to
set channel bandwidth to full bandwidth. The signal
being measured can pass through even if it contains
high frequency quantities.
• Press [F3] to set bandwidth limit to 20MHz. All high
frequency quantities higher than 20MHz in the signal
being tested will be limited.

8
Setting bias voltage
• Bias voltage is suitable for observing the following signals:
• The input signal is made up of relatively high DC quantities and relatively low AC
quantities.
• The input AC signal is very low in frequency and contains DC quantities. AC mode
is unsuitable.
• Duty ratio of the signal is too small. Waveform details are hard to observe even in
AC mode.
Setting the probe rate
• To match the probe attenuation factor setup, it is
necessary to set up the probe attenuation factor
in the channel operation menu accordingly. For
example, when the probe attenuation factor is 10:1,
set the probe attenuation factor at 10X in the menu.
• Apply this principle to other values to ensure the
voltage reading is correct.
• Press [A] to turn Channel A on, then press [F5].
Select “Others” and select 10X probe ratio with the
jog dial, as shown.
• Next press the jog dial once to conrm, then press
the jog dial again to close the menu.
The screen shows the setup and vertical range
display when the probe is set at 10:1.
Setting the waveform polarity
• Inverted waveform : This indicates the signal is 180°
inverted in relation to the channel ground level. The
example below shows the setup for signal inversion
and the display for inverted signal.
• Press [A] to turn Channel A on.
• Press [F5]. Select “Others” and select inverted
polarity, as shown in Figure 2-13.
• Press the jog dial once to conrm, then press the jog
dial again to close the menu.
• The screen shows the channel polarity inverted.
Changing the signal time base and horizontal shift
• Accelerate or decelerate the oscilloscope’s scanning
rate by pressing from 5ns/div~50s/div (72-9360).
Note: Minimum horizontal time base range of the 72-93xx Series varies from model to
model.
S nS

9
Trigger System Setup
• Triggering decides when the oscilloscope collects data and display waveforms.
Once the trigger is correctly set up, it can transform unstable displays into
meaningful waveforms.
• When beginning to acquire data, the digital storage oscilloscope rst collects
sufcient data required for drawing a waveform on the left side of the trigger point.
• While waiting for the triggering condition, the oscilloscope will continue acquiring
sufcient data to draw a waveform on the right side of the trigger point. You can set
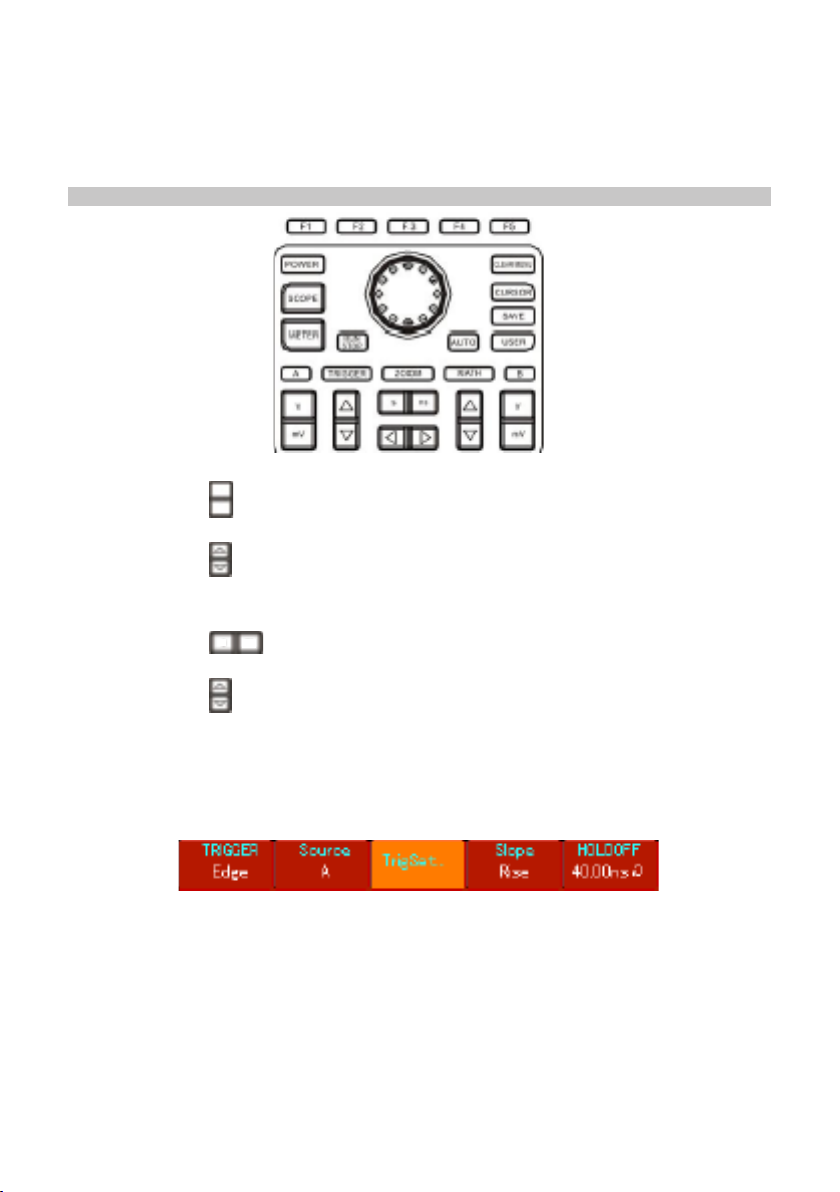
trigger functions with the trigger function key [TRIGGER].
Trigger : Key for the trigger function setup menu.
Trigger level : Trigger level is set to a signal voltage that matches the trigger point (by
turning the jog dial).
Trigger types : Edge, Video, Pulse.
Edge trigger :
Trigger is set to occur when the signal is at the rising or falling edge. You
can set the trigger level to change the trigger point’s vertical position on the trigger edge,
i.e. the intersection point of the trigger level line and the signal edge on the screen.
Function
Setup Explanation
Trigger Edge Set edge as the trigger type
Trigger
source
A
B
Alternate
Set Channel A as the signal source trigger signal.
Set Channel B as the signal source trigger signal.
A and B trigger their individual signals alternately
Trigger
Setup
Trigger
Mode
Auto
Normal
Single
Waveform is acquired even when no trigger condition is
detected.
Acquisition takes place only when trigger condition is met.
One waveform is acquired when one trigger is detected.
Acquisition then stops.
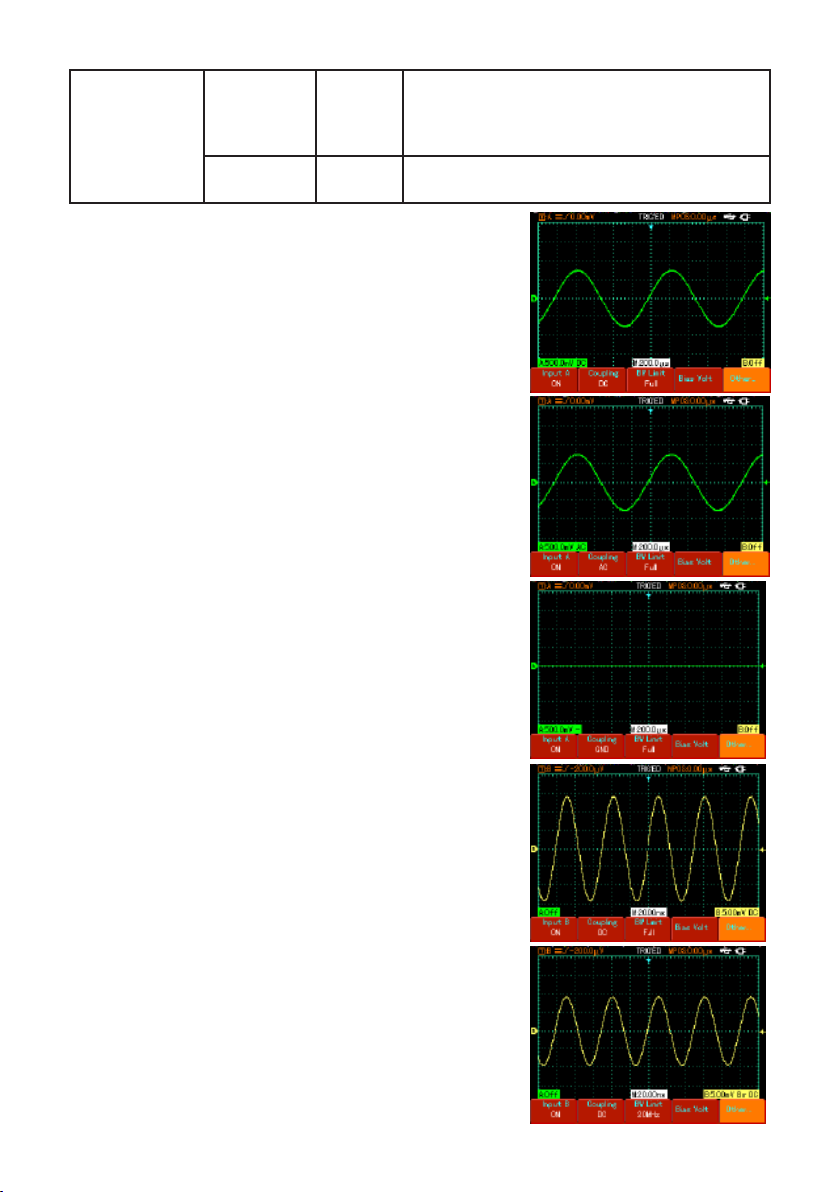
Trigger
Coupling
AC
DC
H/F Suppression
L/F Suppression
Allow AC and DC quantities of the input signal to pass.
Intercept DC quantities of the input signal.
Reject low frequency quantities below 80kHz of the signal.
Reject high frequency quantities above 80kHz of the signal
Slew
Rate
Rise
Fall
Set to trigger at the signal’s rising edge.
Set to trigger at the signal’s falling edge.
Holdoff 40ns – 1.5s Adjust holdoff time.
Adjusting Hold-off Time
• You can adjust the hold-off time to observe complicated waveforms (e.g. pulse
string series). Hold-off time means adjusting the data acquisition cycle of the
digital storage oscilloscope. It is an exact multiple of the cycle of the complicated
waveform being tested, thus synchronization is possible.
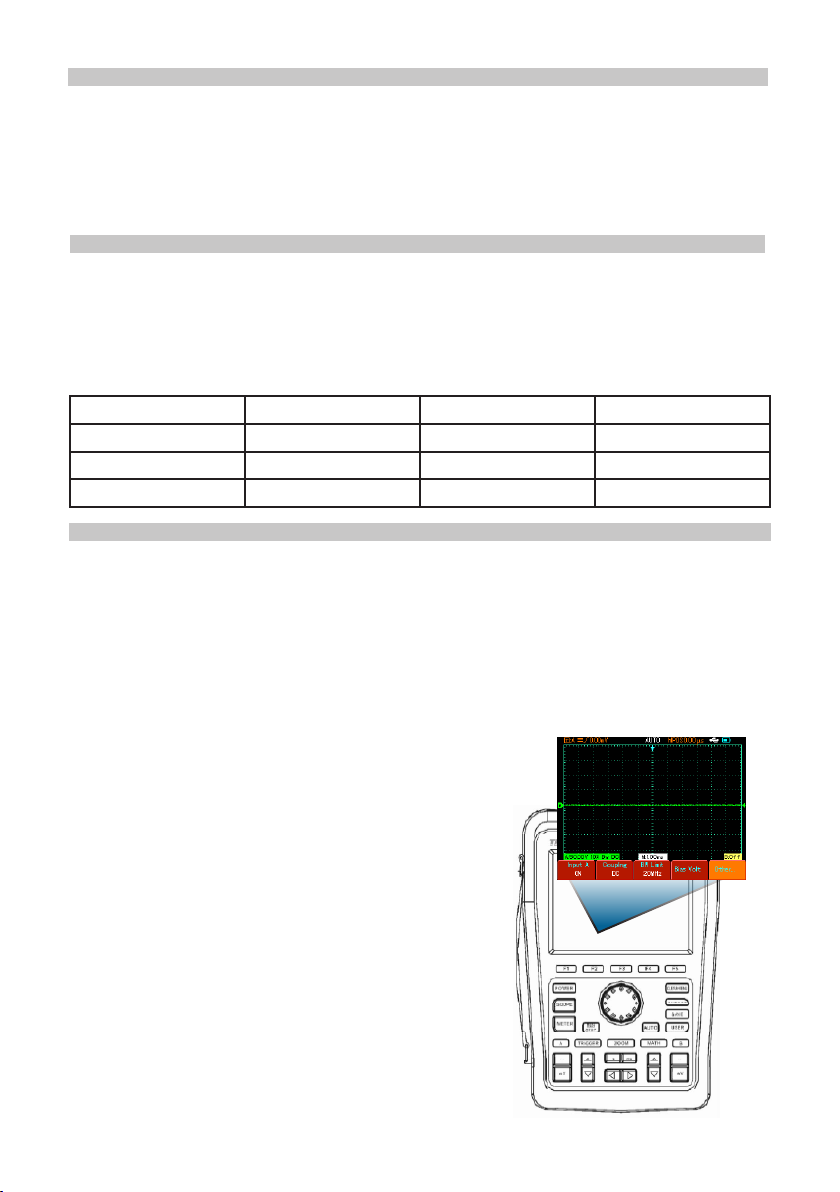
For example: if the signals being tested are a group of wave signals, apply them to
Channel A then press [TRIGGER] to select edge trigger mode.
Next press [F5] to activate hold-off adjustment and adjust
hold-off time with the jog dial. Hold-off time will change
accordingly until waveform display is stable, as shown.
Note: Hold-off time is usually slightly shorter than
the “large cycle” time. When observing the RS-232
communication signal, it is easier to achieve stable
synchronization of hold-off time is slightly shorter than the
starting edge time of every set of data.

10
Functions Menu Setup Notes
Trigger Video Set video trigger as trigger type.
Trigger source
A
B
Alternate
Set A as the signal source trigger signal.
Set B as the signal source trigger signal.
A and B trigger their individual signals respectively.
Standard trigger PAL
NTSC
Suitable for PAL video signals.
Suitable for NTSC video signals
Synchronisation
All lines
Specied lines
Odd eld
Even eld
Set the TV line to synchronize with trigger.
Set synchronized trigger on the specied line and
adjust with the jog dial.
Set the video odd eld to synchronized trigger.
Set the video even eld to synchronized trigger.
Pulse Trigger
• When the pulse width of the trigger signal reaches a preset trigger condition, trigger
occurs.
• Pulse trigger means determining the triggering time based on the pulse width. You
can acquire abnormal pulse by setting the pulse width condition.
Video trigger : Carry out eld or line trigger with NTSC or PAL standard video signals.
Function
Setup Explanation
Trigger Pulse Set edge as the trigger type.
Trigger
source
A
B
Alternate
Set Channel A as the signal source trigger signal.
Set Channel B as the signal source trigger signal.
A and B trigger their individual signals alternately.
Trigger
setup
Trigger
mode
Auto
Normal
Single
Set to acquire waveform only if no trigger is detected.
Set to acquire waveform only if trigger condition is satised.
Set to acquire one waveform when one trigger is detected,
then stop.
Trigger
coupling
AC
DC
H/F Reject
L/F Reject
Intercept AC and DC quantities of the input signal.
Intercept DC quantities of the input signal.
Suppress low frequency quantities below 80kHz of the signal.
Suppress high frequency quantities above 80kHz of the signal.
Pulse
width 40ns – 6.40s Set pulse width with the jog dial.
Pulse
width
setup
Pulse width
condition
=
<
>
Trigger occurs when pulse width equals to the set value.
Trigger occurs when pulse width is smaller than the set value.
Trigger occurs when pulse width is larger than the set value.
Pulse width
polarity
Positive
Negative
Set the positive pulse width as the trigger signal.
Set the negative pulse width as the trigger signal.
• When PAL is selected for standard format and
synchronization mode is “specied line”, you will see
a screen display as shown.

11
Denitions
1. Trigger source: Trigger can be obtained from various sources : Input channel (A or
B) and alternate.
• Input Channel : The most common trigger source is input channel (choose A or
B). The channel selected as trigger source can operate normally only when the
corresponding input channel is on.
2. Trigger mode: Determine the action of your oscilloscope at trigger by selecting the
mode. This oscilloscope offers three trigger modes for selection: auto, normal and
single.
• Auto Trigger: The system will acquire waveform data automatically when there is
no trigger signal input. The scan baseline is shown on the display. When the trigger
signal is generated, it automatically turns to trigger scan for signal synchronization.
Note: When time base of the scan range is set to 50ms/div or slower, the
oscilloscope will enter the “Scan” mode.
• Normal Trigger: In this mode, your oscilloscope samples waveforms only when
triggering conditions are met. The system stops acquiring data and waits when
there is no trigger signal. When the trigger signal is generated, trigger scan occurs.
• Single Trigger: In this mode, you only have to press the “Run” button once and
the oscilloscope will wait for trigger. One sampling will occur and the acquired
waveform will be displayed when the oscilloscope detects a trigger. Then trigger will
stop.
3. Trigger coupling: Trigger coupling determines which quantities of the signal
are transmitted to the trigger circuit. Coupling modes are DC, AC, low frequency
suppression and high frequency suppression.
• DC: Allowing all quantities to pass.
• AC: Intercepting DC quantities and attenuating signals under 10Hz.
• Low Frequency Suppression: Intercepting DC quantities and attenuating low
frequency quantities under 80kHz.
• High Frequency Suppression: Attenuating high frequency quantities over 80kHz.
• When synchronization mode is “odd eld”, you will
see a screen display as shown.
Alternate Trigger
• When alternate trigger is selected, trigger signals will
be present in their individual vertical channels. This
triggering mode is suitable for observing two signals
of uncorrelated signal frequencies.
• Alternate trigger can also be used to compare pulse
widths.

12
Functions
Menu Setup Notes
(Press F1)
Acquisition mode
See Note A
Sampling
Peak detect
Average
Set to standard sampling mode.
Set to peak detect mode.
Set to average sampling and display the average number of times.
Average number
of times (when
average sampling
is selected)
2~256 Set the average number of times in multiples of 2, i.e. 2, 4,
8, 16, 32, 64, 128, 256. To change the average number of
times, use the jog dial.
Sampling mode
Real time
Equivalent
Set sampling to real time.
Set sampling to equivalent at a time base range of
5ns~100ns/div.
(Press F3)
Display type
See Note B
Vector
Dot
Sampling points are linked for display.
Sampling points are directly displayed.
Duration
Off
2s
5s
Innite
Waveform on the screen is refreshed at normal rate.
Waveform on the screen is maintained for 2 seconds and
then refreshed.
Waveform on the screen is maintained for 5 seconds and
then refreshed.
Waveform on the screen remains on display. New data will
be added continuously.
Format
YT
XT
Operating mode of the oscilloscope.
X-Y is the display mode; A input signal is X signal, B input
signal is Y signal.
(Press F2)
Parameter
Measurement
Customised
All parameters
OFF
The screen displays only user-dened parameters.
All 27 parameters are displayed.
Close the automatic measurement function.
Customised
parameters
Parameter 1
Parameter 2
Parameter 3
Up to 3 parameters can be displayed simultaneously on
screen.
No. of parameters Total 27 Select with the jog dial
Channel
A
B
OFF
Display measurement value of Channel A.
Display measurement value of Channel B.
Close the automatic measurement display.
Indicator
Parameter 1
Parameter 2
Parameter 3
This function offers visual indication of the parameter being
tested.
Frequency
Counter
ON
OFF
Turning the frequency counter on/off
4. Pre-trigger/Delayed Trigger: Data sampled before/after triggering.
The trigger position is typically set at the horizontal center of the screen. In this
case, you are able to view 6 divisions of pre-trigger and delayed information.
Adjusting the horizontal position of the waveform allows you to see more pre-trigger
information. By observing pre-trigger data, you can see the waveform before trigger
occurs. For example, you can detect the glitch that occurs when the circuitry starts.
Observation and analysis of trigger data can help you identify the cause of glitch.
Acquisition Modes, Display and Automatic Measurement
• Press [SCOPE] to access frequently used function options, as shown in the table.

13
Note A
• Use Real time sampling to observe single signals.
• Use Equivalent sampling to observe high frequency cyclical signals.
• To avoid mixed envelop, select Peak Detect.
• To reduce random noise of the displayed signal, select average sampling and
increase the average number of times in multiples of 2, i.e selecting from 2 to 256.
Denitions :
1. Normal sampling mode : The digital storage oscilloscope acquires signal sample
at equal and regular intervals to reconstruct the waveform.
2. Peak detect mode : In this acquisition mode, the digital storage oscilloscope
identies the biggest and smallest values of the input signals at each sampling
interval and uses these values to display the waveform. In effect, it can acquire
and display narrow pulse which would otherwise be omitted in the sampling mode.
Noise seems to be more signicant in this mode.
3. Average mode : The digital storage oscilloscope acquires several waveforms and
takes the average value to display the nal waveform. You can use this mode to
reduce random noise.
Note B
Denitions :
1. Display Type : Vector display lls the space between adjacent sample points in the
display. Dot display shows only the sampling points.
2. Refresh rate : Refresh rate is the number of times the digital storage oscilloscope
refreshes the waveform display per second. The refreshing speed affects the
capability to observe signal movements speedily.
3. X-Y Mode
This mode can be activated only when Channel A and Channel B are both on. After
selecting the X-Y display mode, the horizontal axis will display the A signal, while
the vertical axis will display the B signal.
Caution: In the normal X-Y mode, you can adjust waveform amplitude with VOLTS/
DIV of the two channels. Adjusting the s/DIV time base will result in a lissajous gure of
better display quality. The following functions are disabled in the X-Y display mode:
• Automatic measurement mode
• Cursor measurement mode
• Reference or function waveform
• Vector display type
• Trigger control
4. Y-T Mode: In this mode the Y axis indicates voltage and the X axis indicates time.
5. X-Y Mode: In this mode the X axis indicates Channel A voltage and the Y axis
indicates Channel B voltage.
6. Slow Scanning Mode: When horizontal time base control is set at 50ms/div or
slower, the unit will operate in the slow scan sampling mode. When observing low
frequency signals in slow scanning mode, it is advised to set channel coupling to
DC.
7. S/ns : A horizontal scaling (time base) unit. If waveform sampling is stopped (by
pressing the [RUN/STOP] button), time base control can expand or compress the
waveform.

14
To display the measurement peak-to-peak value of Channel A
• Press [A] to turn on Channel A.
• Press [SCOPE] to enter the frequently used function menu.
• Press [F2] to enter the parameter measurement options.
• Press [F1] to select customized parameter for
parameter measurement.
• Press [F2] to select parameter 1 as the
customized parameter.
• Press [F3] then turn the jog dial to select peak-
to-peak value, then press the jog dial once to
conrm and exit from the current menu.
• Press [F4] to select Channel A.
• Press [F5] to set indicator to parameter 1.
Note : Customized parameters are for quick parameter measurement. This device has
27 measurement parameters. In general use, the user is not required to measure all
parameters. Only a few have to be tested. In this case, set the parameters you require
as customized parameters. All such parameters will be displayed on the screen.
Automatic measurement of parameters
Your oscilloscope can automatically measure the following voltage parameters of the
waveform :
• Maximum value (Vmax): The voltage value from the highest point to ground (GND).
• Minimum value (Vmin): The voltage value from the lowest point to ground (GND).
• Top value (Vtop): The voltage value from top to ground (GND).
• Base value (Vbase): The voltage value from base to ground (GND).
• Middle value (Vmid): Half of the amplitude value.
• Peak-to-peak value (Vpp): The voltage value from the highest point to lowest point.
• Amplitude value (Vamp): The voltage value from top to base.
• Overshoot: The ratio value of the difference between maximum value and top value
to the amplitude value.
• Preshoot: The ratio value of the difference between minimum value and top value to
the amplitude value.
• Average value: Average amplitude of signals within 1 cycle.
• Root mean square value (Vrms) : The effective value. Energy generated by AC signal
conversion during 1 cycle with respect to the DC voltage that produces equivalent
energy, i.e. root mean square value.
Your oscilloscope can automatically measure the following time parameters:
• Rise Time: The time taken by the waveform to rise from 10% to 90%.
• Fall Time: The time taken by the waveform to fall from 90% to 10%.
• Positive Pulse Width (+Width): The pulse width when positive pulse is at 50%
amplitude.
• Negative Pulse Width (-Width): The pulse width when negative pulse is at 50%
amplitude.
• Rising delay (Rise): Delayed time of the rising edge from A to B.
• Falling delay (Fall): Delayed time of the falling edge from A to B.
• Positive duty ratio (+Duty): Ratio of positive pulse width to cycle.
• Negative duty ratio (-Duty): Ratio of negative pulse width to cycle.
OPERATION

15
To display all measurement values of Channel A
• Press [A] to turn on Channel A.
• Press [SCOPE] to enter the frequently used function
menu.
• Press [F2] to enter the parameter measurement
options.
• Press [F1] to select customized parameter for
parameter measurement.
• All measurement parameters will be shown on screen.
Storage Setups and Screen Copy
• Press [SAVE] to access the
storage menu.
• You can save and recall
waveforms and setup documents on the oscilloscope’s internal memory and
any USB device. You can also save and recall waveform documents and setup
documents on a USB device.
Functions Menu Setup Notes
Save
Setup
Waveform A
Waveform B
Save the current setups of all menus.
Save the Channel A waveform.
Save the Channel B waveform.
Medium Internal
USB
Save the setup and waveform documents internally.
Save the waveform document on the USB device.
Position 1~10
Set and select the storage position with the jog dial.
Run
Run the previously selected operation.
Return
Go back to previous menu.
Functions Menu Setup Notes
Save Setup
Reference waveform
Recall a saved setup.
Recall and display a saved waveform.
Source Internal
USB
Position 1~10
Set and select the storage position with the jog dial.
Run
Run the previously selected operation.
Return
Go back to previous menu.
Screen copy
• With this function, you can save the display interface on the USB device.
• Press [A] to turn on Channel A.
• Insert the USB device into the USB jack.
• Press and hold the [SAVE] button for 4 to 5 seconds and then release. The
“Saving.......” progress bar will appear. The display interface is successfully saved
on the USB device when that progress bar disappears.
• You can see the saved USB image on your computer. It is saved in the root
directory of the USB device.
Recall
• In the storage menu press [F2] to select the recall function:

16
To request recalling a recorded waveform document saved on the USB device
• Insert the USB device and press [SAVE] to access the storage menu. Press [F3] to
select the recording function.
• Press [F3] to select “import”, then press [F2] to
activate the “USB document” option. Select “3” with
the jog dial and press [F4]. The playback waveform
will appear on screen when the “Loading.......”
progress bar disappears.
• If [F3] is pressed again, all recorded waveform
screens will be displayed. Press [F3] to stop
playback, then select playback of a certain screen of
waveform with the jog dial.
Record
• Press [SAVE] to access the storage menu, then press [F3] to select the record
function.
• Press [F1] to activate the waveform recording function. The system enters the
recording mode. The number of screens being recorded is shown in the top right
corner.
• When all specied screens are recorded, press [F1] to close the recording function.
All recorded waveforms will be saved internally.
• Insert the USB device and press [F4] to access the record and save menu. Press
[F2] to activate the “USB document” option, then select “3” with the jog dial.
• Press [F4]. The waveform is successfully recorded on the USB device when the
“Saving.......” progress bar disappears.
Functions Menu Setup Notes
Waveform record ON
OFF
Recall a saved setup.
Recall and display a saved waveform.
Playback
Screen
Single screen
Playback
Return
The number of screens being played and total number of screens
Select single screen playback with the jog dial.
Play and pause a recorded waveform document.
Go back to the previous menu.
Import USB document
(1-10)
Import the recorded waveform document on the USB
device to the oscilloscope.
Save USB document
(1-10)
Save the recorded waveform on the USB device.
Return
Go back to previous menu.
Note: Your 72-93xx Series Digital Storage Oscilloscope can record up to 1,000 screens
of waveform data. If any of the following operations is activated during recording, the
oscilloscope will restart recording from screen 1 again :
• Changing vertical range of the signal
• Changing horizontal time base of the signal
• Changing horizontal position of the signal
• Changing vertical position of the signal

17
Cursor Measurement
• Press [CURSOR] to display the cursor measurement menu, and then press [F1] to
activate the cursor.
• The [CURSOR] menu offers two cursor measurement modes: voltage and time.
• When measuring voltage, press [F2] on the front panel and the jog dial to adjust the
positions of the two cursors for ΔV measurement. Likewise, by selecting time, you
can measure Δt.
Voltage/time measurement modes: Positions of cursor 1 and cursor 2 can be adjusted
with the jog dial and [F2] key.
• Press [F2] to make the cursor move in solid line, and then adjust it with the jog dial
to a desired position. If you require to move two cursors simultaneously, press [F4]
to turn the “Co-Movement” function ON.
• The cursor measurement value is displayed in the top left corner.
Utility Function Setup
• Press [USER] to pop up the utility system setup menu.
Functions Menu Setup Notes
Option
Energy
save
mode
OFF
5 min
10 min
15 min
20 min
When operating with battery, the device
will power off at the set interval to save
battery power if the unit remains idle.
If DC power adaptor is connected, this
energy-save mode is disabled.
Language Simplied Chinese
Traditional
Chinese
English
Select the interface language
Interface
design
Classic
Traditional
Modern
Set the interface design
Help ON
OFF
Turn the help function on/off.
Auto calibration Cancel
OK
Cancel auto system calibration.
Run auto system calibration.
System info
Display the software and hardware
version information
Contrast
Adjust the display brightness
Setting the energy-save mode
• The initial auto power-off time is 10 minutes. To adjust this follow the steps below:
• Press [USER] for the utility menu.
• Press [F1] to access the user option menu.
• Select the energy-save off time with the jog dial.
• Press the jog dial to conrm until the current menu is closed.
Auto Calibration :
• You can correct measurement errors caused by environmental changes with the
auto calibration function. This process can be run when necessary.
• To make calibration more accurate, power on your oscilloscope and allow 20
minutes to warm up.
• Then press the [USER] button, then [F3] and follow the on-screen prompts.

18
Operating Math Functions
• Math functions are displays of +, -, ×, ÷ and FFT mathematical results of Channel A
and Channel B.
• Press [MATH] then [F1] to select FFT, +, -, ×, ÷ or OFF as the math type.
Functions Menu Setup Notes
Math
+
-
x
÷
OFF
Signal source 1 + Signal source 2.
Signal source 1 - Signal source 2.
Signal source 1 x Signal source 2.
Signal source 1 ÷ Signal source 2.
Close the math function.
Signal source 1 A
B
Set signal source 1 as Channel A waveform.
Set signal source 1 as Channel B waveform.
Signal source 2 A
B
Set signal source 2 as Channel A waveform.
Set signal source 2 as Channel B waveform.
Vertical range 5mV-50V
Display the current math range and adjust with the jog dial.
Shift --
You can shift the math waveform with the jog dial.
Functions Menu Setup Notes
FFT
Hanning
Hamming
Blackman
Rectangle
Set Hanning window function.
Set Hamming window function.
Set Blackman window function.
Set Rectangle window function.
Signal source A
B
Set A as the math waveform.
Set B as the math waveform.
Horizontal range 305.1 MHz-
244.1MHz
Display the frequency per division (f/div) of the current
horizontal axis.
Vertical range 5mV-50V
Display the current FFT range and adjust with the jog dial.
Shift --
You can shift the math waveform with the jog dial.
• Press [MATH] then [F1] select FFT as the math type.
FFT spectrum analysis
• By using the FFT (Fast Fourier Transform) algorithm, you can convert time domain
signals (YT) into frequency domain signals. With FFT, you can conveniently
observe the following types of signals:
• Measure the harmonic wave composition and distortion of the system
• Demonstrate the noise characteristics of the DC power
• Analyze oscillation
How to operate FFT functions
• Signals with DC quantities or offset signals will cause error or offset of FFT
waveform quantities. To reduce DC quantities, select “AC” coupling. To reduce
random noise and frequency aliasing resulted by repeated or single pulse event,
set the acquiring mode of your oscilloscope to “Average” acquisition.
Select the FFT Window
• Assuming the YT waveform is constantly repeating itself, the oscilloscope will carry
out FFT conversion of time record of a limited length. When this cycle is a whole
number, the YT waveform will have the same amplitude at the start and nish.
There is no waveform interruption. However, if the YT waveform cycle is not a

19
whole number, there will be different amplitudes at the start and nish, resulting
in transient interruption of high frequency at the connection point. In frequency
domain, this is known as leakage. To avoid leakage, multiply the original waveform
by one window function to set the value at 0 for start and nish compulsively. For
application of the window function, please see the table below :
FFT
Window Feature Most suitable measurement item
Hanning
Frequency recognition rate is better than
the rectangle window, but amplitude
recognition rate is poorer.
Sine, cyclical and narrow-band random
noise.
Hamming Frequency recognition rate is marginally
better than Hanning window.
Temporary or fast pulse. Signal level
varies greatly before and after.
Blackman The best amplitude recognition rate and
the poorest frequency recognition rate.
Mainly for single-frequency signals to
search for higher-order harmonic wave.
Rectangle
The best frequency recognition rate,
the worst amplitude recognition rate.
Basically similar to a status without
adding window.
Temporary or fast pulse. Signal level
is generally the same before and
after. Equal sine wave of very similar
frequency. There is broad-band random
noise with slow moving wave spectrum.
Denitions:
FFT recognition rate: It means the quotient of the sampling and math points. When
math point value is xed, the sampling rate should be as low as possible.
Nyquist frequency: To rebuild the original waveform, at least 2f sampling rate should
be used for waveform with a maximum frequency of f. This is known as Nyquist stability
criterion, where f is the Nyquist frequency and 2f is the Nyquist sampling rate.
Window Extension
• Window extension can be used to zoom in a band
of waveform to check image details. The window
extension setting must not be slower than that of the
main time base as shown.
• In the window extension mode, the display is divided
into two zones as shown in Figure 2-28. The upper
part displays the original waveform. You can move
the horizontally extended part of this zone left and right with the button, or
enlarge and reduce the selected zone with the button.
• The lower part is the horizontally extended waveform of the selected original
waveform zone. Please note that the recognition rate of extended time base relative
to the main time base is now higher (as shown in the above gure). Since the
waveform shown in the entire lower part corresponds to the selected zone in the
upper part, you can increase the extended time base by pressing the button
to decrease the size of the selected zone. In other words, you can increase the
multiple of waveform extension.
S
S
nS
nS
Hiding the Menus
• Use the [CLEAR/MENU] key to hide the current menu. To display a menu, press
any menu key.

20
Using the Run button
• There is a [RUN/STOP] button on the front panel. When this button is pressed your
oscilloscope stops acquiring data. To restart data acquisition, press it again.
Auto Setup:
• Auto Setup can simplify operation.
• Press [AUTO] and the oscilloscope can automatically adjust the vertical deection
factor and horizontal time base range according to the amplitude and frequency of
the waveform, so as to ensure stable waveform display.
• When the oscilloscope is in auto setup mode, the system setup is as in the table
below.
Function Setup
Acquisition mode Sampling
Display format YT
SEC/DIV Adjusted according to signal frequency
VOLT/DIV Adjusted according to signal amplitude
Trigger mode Edge
Trigger level Mid point of the signal
Trigger coupling AC
Trigger source Set to A but if there is no signal in A and a signal is applied to B it will be
set to B
Trigger slew rate Rising
Trigger type Auto
Multimeter Measurement
• Operation instructions: Open the multimeter function menu by pressing [METER].
Functions Menu Setup Notes
Type
DC voltage
AC voltage
Resistance
ON/OFF
Diode
Capacitance
DC current
AC current
Select the DC voltage measurement mode.
Select the AC voltage measurement mode.
Select the resistance measurement mode.
Select the ON/OFF measurement mode.
Select the diode measurement mode.
Select the capacitance measurement mode.
Select the DC current measurement mode.
Select the AC current measurement mode.
Range mode Auto
Manual
The multimeter automatically selects an appropriate
range for measurement. The user manually selects an
appropriate range for measurement.
Range
Display the current measurement range.
Trend plot ON/OFF
Turn the trend plot function on/off. This function records
the moving trends of voltage, current, resistance within a
specied period.
Zero line value
When trend plot is on, the zero line value enhances the
trend plot resolution.
This manual suits for next models
3
Table of contents
Other Tenma Test Equipment manuals

Tenma
Tenma 72-9966 User manual

Tenma
Tenma 72-7985 User manual

Tenma
Tenma 72-14520 User manual

Tenma
Tenma TEN01057 User manual

Tenma
Tenma 72-2680 User manual

Tenma
Tenma 72-2650 User manual

Tenma
Tenma 72-10175 User manual

Tenma
Tenma 72-490 User manual

Tenma
Tenma 72-6694 User manual

Tenma
Tenma 72-2665 User manual

Tenma
Tenma 72-9400A User manual

Tenma
Tenma 72-3575 User manual

Tenma
Tenma DSO User manual

Tenma
Tenma 72-9405 User manual

Tenma
Tenma 72-17175 User manual

Tenma
Tenma 72-7630 User manual

Tenma
Tenma 72-7910 User manual

Tenma
Tenma 72-6947 User manual

Tenma
Tenma 72-3565 User manual

Tenma
Tenma DSO Series User manual